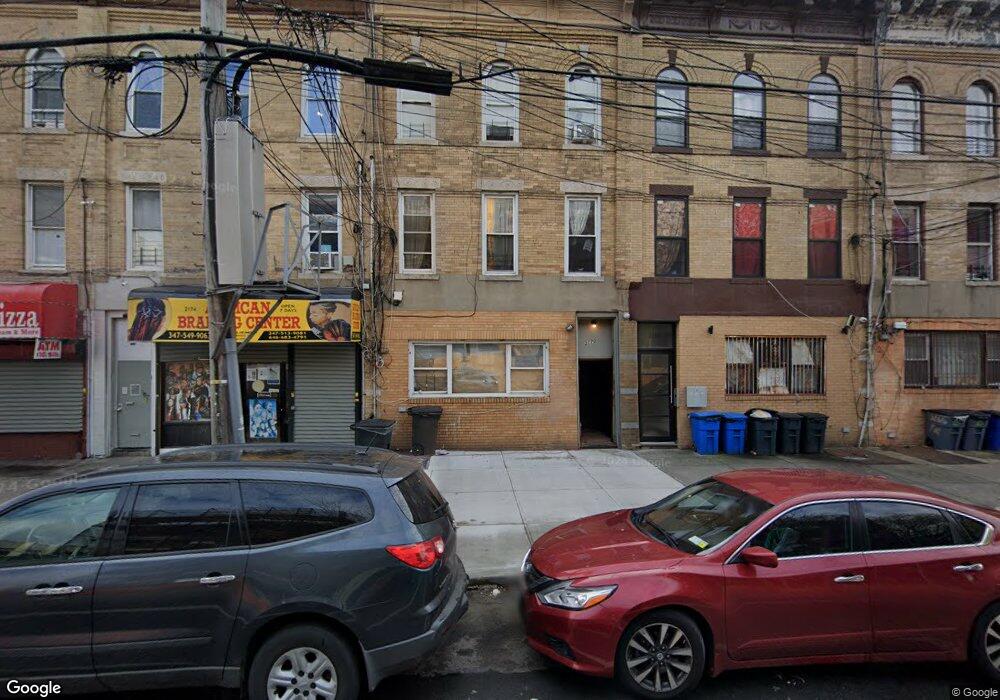
2170 Pitkin Ave Unit 3 Brooklyn, NY 11207
East New York NeighborhoodEstimated Value: $994,324 - $1,128,000
--
Bed
1
Bath
3,075
Sq Ft
$339/Sq Ft
Est. Value
About This Home
This home is located at 2170 Pitkin Ave Unit 3, Brooklyn, NY 11207 and is currently estimated at $1,043,581, approximately $339 per square foot. 2170 Pitkin Ave Unit 3 is a home located in Kings County with nearby schools including P.S. 149 Danny Kaye, J.H.S 292 Margaret S. Douglas, and Hyde Leadership Charter School-Brooklyn.
Ownership History
Date
Name
Owned For
Owner Type
Purchase Details
Closed on
Aug 5, 2025
Sold by
Chen Meidong
Bought by
2170 Pitkin Llc
Current Estimated Value
Purchase Details
Closed on
Feb 5, 2024
Sold by
Goldman Zalman
Bought by
Chen Meidong
Purchase Details
Closed on
Jul 1, 2012
Sold by
Goldman Pearl
Bought by
Goldman Zalman
Purchase Details
Closed on
Nov 7, 2007
Sold by
Goldman Pearl and Goldman Zalman L
Bought by
Goldman Pearl
Purchase Details
Closed on
Jun 4, 2007
Sold by
2170 Pitkin Avenue Llc
Bought by
Goldman Pearl and Goldman Zalman L
Purchase Details
Closed on
Nov 7, 2002
Sold by
United Property Group Llc
Bought by
Goldman Zalman L
Purchase Details
Closed on
Apr 9, 2002
Sold by
Roberson Regina Heir and Robinson Mitchell J
Bought by
Roberson Regina and Roberson Mitchell J
Create a Home Valuation Report for This Property
The Home Valuation Report is an in-depth analysis detailing your home's value as well as a comparison with similar homes in the area
Home Values in the Area
Average Home Value in this Area
Purchase History
| Date | Buyer | Sale Price | Title Company |
|---|---|---|---|
| 2170 Pitkin Llc | -- | -- | |
| Chen Meidong | $918,000 | -- | |
| Chen Meidong | $918,000 | -- | |
| Goldman Zalman | -- | -- | |
| Goldman Zalman | -- | -- | |
| Goldman Pearl | -- | -- | |
| Goldman Pearl | -- | -- | |
| Goldman Pearl | -- | -- | |
| Goldman Pearl | -- | -- | |
| Goldman Zalman L | $400,000 | -- | |
| Goldman Zalman L | $400,000 | -- | |
| Roberson Regina | -- | -- | |
| Roberson Regina | -- | -- |
Source: Public Records
Mortgage History
| Date | Status | Borrower | Loan Amount |
|---|---|---|---|
| Closed | Goldman Zalman L | $0 |
Source: Public Records
Tax History Compared to Growth
Tax History
| Year | Tax Paid | Tax Assessment Tax Assessment Total Assessment is a certain percentage of the fair market value that is determined by local assessors to be the total taxable value of land and additions on the property. | Land | Improvement |
|---|---|---|---|---|
| 2025 | $3,886 | $59,820 | $13,320 | $46,500 |
| 2024 | $3,886 | $57,240 | $13,320 | $43,920 |
| 2023 | $3,710 | $64,680 | $13,320 | $51,360 |
| 2022 | $3,447 | $58,920 | $13,320 | $45,600 |
| 2021 | $3,431 | $54,420 | $13,320 | $41,100 |
| 2020 | $1,705 | $47,100 | $13,320 | $33,780 |
| 2019 | $3,373 | $47,100 | $13,320 | $33,780 |
| 2018 | $3,104 | $15,225 | $5,559 | $9,666 |
| 2017 | $2,933 | $14,389 | $5,297 | $9,092 |
| 2016 | $2,716 | $13,584 | $5,309 | $8,275 |
| 2015 | $1,417 | $13,584 | $3,989 | $9,595 |
| 2014 | $1,417 | $13,436 | $3,983 | $9,453 |
Source: Public Records
Map
Nearby Homes
- 301 Wyona St
- 243 Wyona St
- 459 Belmont Ave
- 2210 Pitkin Ave
- 279 van Siclen Ave
- 346 van Siclen Ave
- 414 Miller Ave
- 207 Bradford St
- 342 Wyona St
- 358 van Siclen Ave
- 412 Hendrix St
- 34&36 Marginal St
- 440 Miller Ave
- 667 Sutter Ave
- 297 Pennsylvania Ave
- 385 van Siclen Ave
- 443 Miller Ave
- 663 Sutter Ave
- 572 Glenmore Ave
- 576 Glenmore Ave
- 2170 Pitkin Ave
- 2170 SE Pitkin Ave
- 2174 Pitkin Ave
- 2168 Pitkin Ave
- 2176 Pitkin Ave
- 2166 Pitkin Ave
- 2166 Pitkin Ave Unit 21
- 2164 Pitkin Ave
- 290 Bradford St
- 290 Bradford St Unit 2
- 290 Bradford St
- 2162 Pitkin Ave
- 2162 Pitkin Ave Unit 3rd fl
- 2162 Pitkin Ave Unit 2
- 292 Bradford St
- 2156 Pitkin Ave
- 2178 Pitkin Ave
- 294 Bradford St
- 281 Wyona St
- 2154 Pitkin Ave