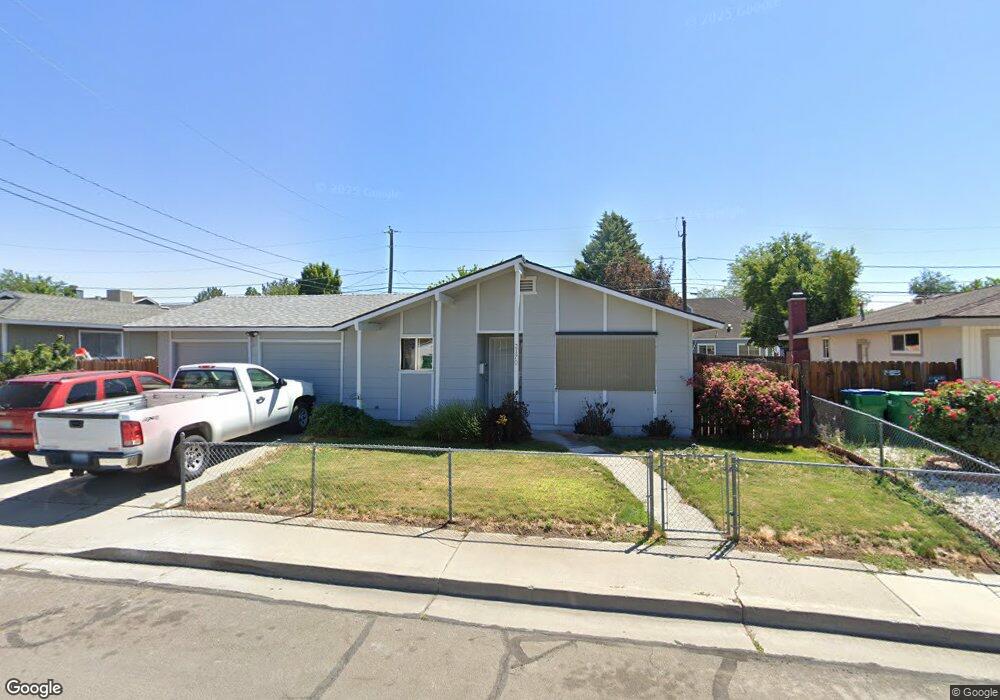
2170 Platora Way Reno, NV 89512
Northeast Reno NeighborhoodEstimated Value: $356,000 - $415,000
4
Beds
2
Baths
1,232
Sq Ft
$308/Sq Ft
Est. Value
About This Home
This home is located at 2170 Platora Way, Reno, NV 89512 and is currently estimated at $379,094, approximately $307 per square foot. 2170 Platora Way is a home located in Washoe County with nearby schools including Rita Cannan Elementary School, Fred W. Traner Middle School, and Procter R. Hug High School.
Create a Home Valuation Report for This Property
The Home Valuation Report is an in-depth analysis detailing your home's value as well as a comparison with similar homes in the area
Home Values in the Area
Average Home Value in this Area
Tax History
| Year | Tax Paid | Tax Assessment Tax Assessment Total Assessment is a certain percentage of the fair market value that is determined by local assessors to be the total taxable value of land and additions on the property. | Land | Improvement |
|---|---|---|---|---|
| 2026 | $787 | $51,477 | $32,830 | $18,647 |
| 2024 | $1,025 | $52,362 | $34,055 | $18,307 |
| 2023 | $996 | $46,430 | $29,505 | $16,925 |
| 2022 | $967 | $38,976 | $25,200 | $13,776 |
| 2021 | $939 | $31,289 | $17,850 | $13,439 |
| 2020 | $911 | $31,830 | $17,850 | $13,980 |
| 2019 | $884 | $30,729 | $16,765 | $13,964 |
| 2018 | $858 | $24,757 | $10,640 | $14,117 |
| 2017 | $833 | $25,420 | $10,850 | $14,570 |
| 2016 | $813 | $23,485 | $8,190 | $15,295 |
| 2015 | $812 | $23,265 | $7,595 | $15,670 |
| 2014 | $788 | $22,679 | $7,210 | $15,469 |
| 2013 | -- | $20,753 | $5,075 | $15,678 |
Source: Public Records
Map
Nearby Homes
- 3230 Wedekind Rd Unit 59
- 3230 Wedekind Rd Unit 72
- 3230 Wedekind Rd Unit 64
- 2575 Garfield Dr
- 2561 Garfield Dr
- 2545 Garfield Dr Unit 18
- 3201 Sterling Ridge Cir
- 35 Tulip Ct
- 113 Lilac Ln
- 112 Lilac Ln
- 2090 Fife Dr
- 3505 Willow Hills Cir
- 180 Poppy Ln
- 135 Carnation Ln
- 74 Lilac Ln
- 2555 Clear Acre Ln Unit 78
- 2555 Clear Acre Ln Unit 16-1
- 3136 Orrizonte Terrace
- 3250 Cityview Terrace
- 2101 Highview Ct Unit 9
- 2180 Platora Way
- 2160 Platora Way
- 2641 Betsy Ct
- 2642 Fanto Ct
- 2621 Betsy Ct Unit 29
- 2622 Fanto Ct
- 2200 Platora Way
- 2150 Platora Way Unit 2
- 2642 Betsy Ct
- 2165 Platora Way
- 2185 Platora Way
- 2622 Betsy Ct Unit 33
- 2601 Betsy Ct
- 2155 Platora Way
- 2602 Fanto Ct Unit 17
- 2641 Fanto Ct Unit 12
- 2602 Betsy Ct
- 2220 Platora Way
- 2201 Platora Way
- 2130 Platora Way
Your Personal Tour Guide
Ask me questions while you tour the home.