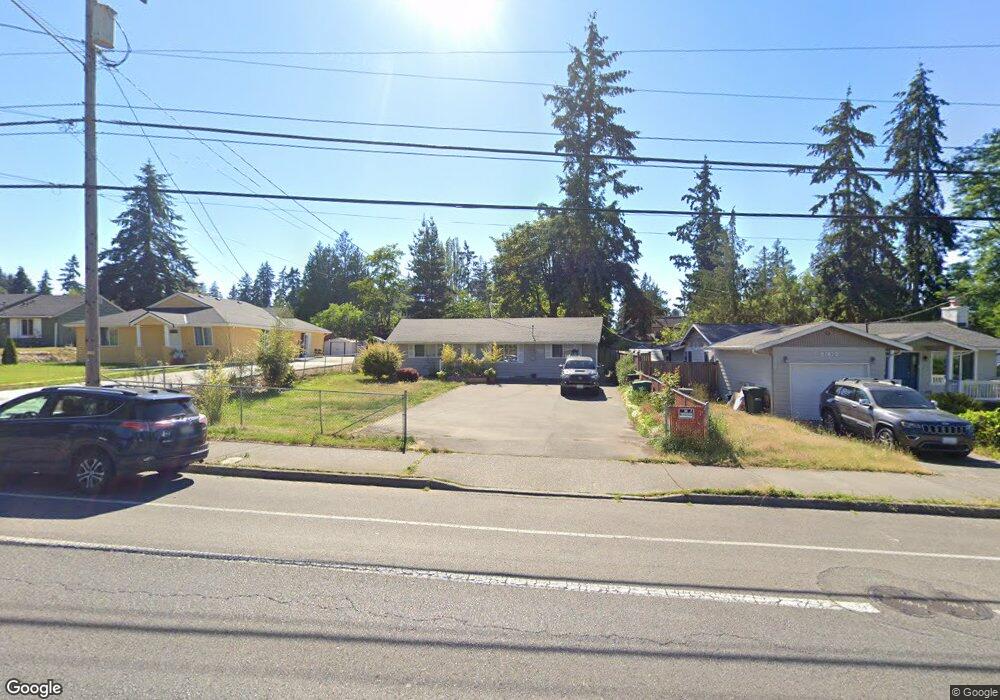
21702 52nd Ave W Mountlake Terrace, WA 98043
Cascade View NeighborhoodEstimated Value: $545,000 - $606,000
2
Beds
1
Bath
1,006
Sq Ft
$571/Sq Ft
Est. Value
About This Home
This home is located at 21702 52nd Ave W, Mountlake Terrace, WA 98043 and is currently estimated at $574,068, approximately $570 per square foot. 21702 52nd Ave W is a home located in Snohomish County with nearby schools including Mountlake Terrace Elementary School, Brier Terrace Middle School, and Mountlake Terrace High School.
Ownership History
Date
Name
Owned For
Owner Type
Purchase Details
Closed on
Feb 22, 2001
Sold by
Soudakov Vladislav and Soudakova Albina
Bought by
Tran My T and Nguyen Hong Yen Thi
Current Estimated Value
Home Financials for this Owner
Home Financials are based on the most recent Mortgage that was taken out on this home.
Original Mortgage
$160,200
Outstanding Balance
$59,122
Interest Rate
7.37%
Estimated Equity
$514,946
Purchase Details
Closed on
Feb 16, 2001
Sold by
Bank One National Assn
Bought by
Soudakov Vladislav and Soudakov Albina
Home Financials for this Owner
Home Financials are based on the most recent Mortgage that was taken out on this home.
Original Mortgage
$160,200
Outstanding Balance
$59,122
Interest Rate
7.37%
Estimated Equity
$514,946
Purchase Details
Closed on
Mar 17, 2000
Sold by
Wilson James M and Wilson Paula R
Bought by
The First National Bank Of Chicago
Create a Home Valuation Report for This Property
The Home Valuation Report is an in-depth analysis detailing your home's value as well as a comparison with similar homes in the area
Home Values in the Area
Average Home Value in this Area
Purchase History
| Date | Buyer | Sale Price | Title Company |
|---|---|---|---|
| Tran My T | $178,000 | First American Title Ins Co | |
| Soudakov Vladislav | $108,000 | -- | |
| The First National Bank Of Chicago | $111,291 | Evergreen Title Company Inc |
Source: Public Records
Mortgage History
| Date | Status | Borrower | Loan Amount |
|---|---|---|---|
| Open | Tran My T | $160,200 |
Source: Public Records
Tax History Compared to Growth
Tax History
| Year | Tax Paid | Tax Assessment Tax Assessment Total Assessment is a certain percentage of the fair market value that is determined by local assessors to be the total taxable value of land and additions on the property. | Land | Improvement |
|---|---|---|---|---|
| 2025 | $4,027 | $518,600 | $416,600 | $102,000 |
| 2024 | $4,027 | $499,800 | $397,800 | $102,000 |
| 2023 | $3,907 | $545,700 | $420,300 | $125,400 |
| 2022 | $3,567 | $409,800 | $303,500 | $106,300 |
| 2020 | $3,352 | $339,600 | $247,400 | $92,200 |
| 2019 | $3,180 | $323,900 | $229,500 | $94,400 |
| 2018 | $3,153 | $279,700 | $195,500 | $84,200 |
| 2017 | $2,593 | $242,300 | $164,900 | $77,400 |
| 2016 | $2,263 | $219,800 | $145,400 | $74,400 |
| 2015 | $2,029 | $184,800 | $125,000 | $59,800 |
| 2013 | $1,716 | $148,300 | $99,900 | $48,400 |
Source: Public Records
Map
Nearby Homes
- 21502 52nd Ave W
- 21502 52nd Place W
- 21504 50th Ave W Unit C3
- 5502 216th St SW
- 21301 52nd Ave W Unit B111
- 21317 52nd Ave W Unit F138
- 5506 216th St SW
- 5030 212th St SW
- 21906 56th Ave W Unit C4
- 21906 56th Ave W Unit C2
- 21305 48th Ave W Unit B201
- 21305 48th Ave W Unit B110
- 5732 Halls Lake Way
- 22406 56th Ave W
- 21429 44th Ave W Unit 24
- 5706 225th St SW
- 20917 59th Place W
- 4122 214th St SW Unit D
- 4126 214th St SW Unit C
- 21204 41st Ct W Unit 2
- 21702 52nd Ave W
- 21610 52nd Ave W
- 21704 52nd Ave W
- 21608 52nd Ave W
- 21703 53rd Ave W
- 21706 52nd Ave W
- 21705 53rd Ave W
- 21701 53rd Ave W
- 21707 53rd Ave W
- 21609 53rd Ave W
- 21606 52nd Ave W
- 5201 218th St SW
- 21707 52nd Ave W
- 21705 52nd Ave W
- 21709 52nd Ave W
- 5207 218th St SW
- 21607 53rd Ave W
- 21604 52nd Ave W
- 21703 52nd Ave W
- 21801 52nd Ave W