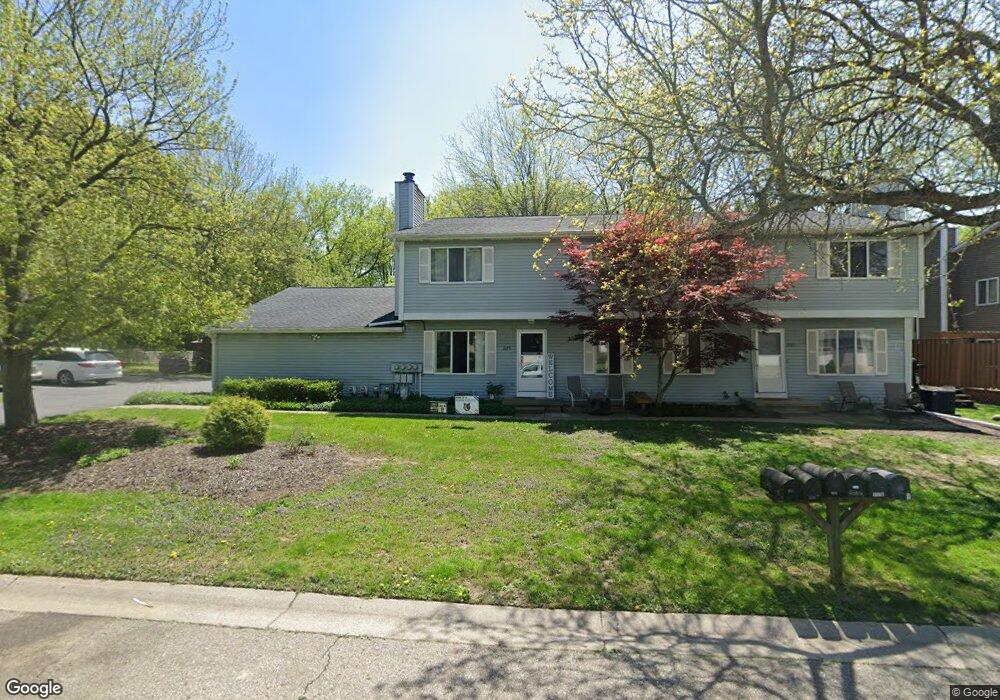
2171 Woodleaf St Okemos, MI 48864
Estimated Value: $288,000 - $671,000
3
Beds
2
Baths
1,162
Sq Ft
$468/Sq Ft
Est. Value
About This Home
This home is located at 2171 Woodleaf St, Okemos, MI 48864 and is currently estimated at $543,962, approximately $468 per square foot. 2171 Woodleaf St is a home located in Ingham County with nearby schools including Hiawatha Elementary School, Kinawa School, and Chippewa Middle School.
Ownership History
Date
Name
Owned For
Owner Type
Purchase Details
Closed on
Jul 3, 2013
Sold by
Maniaci Charles G and Maniaci Renee A
Bought by
Wood Leaf Townhomes Llc and Chares G Maniaci Revocable Trust
Current Estimated Value
Purchase Details
Closed on
Jan 11, 2013
Sold by
Wood Leaf Townhouses Llc
Bought by
Maniaci Charles G and Maniaci Renee A
Purchase Details
Closed on
Feb 7, 2007
Sold by
Manivest Llc
Bought by
Wood Leaf Townhouses Llc
Purchase Details
Closed on
Aug 15, 2005
Sold by
Maniaci Charles G and Maniaci Renee A
Bought by
Manivest Llc
Purchase Details
Closed on
Feb 3, 2005
Sold by
Organek Gary
Bought by
Maniaci Charles G and Maniaci Renee A
Home Financials for this Owner
Home Financials are based on the most recent Mortgage that was taken out on this home.
Original Mortgage
$296,250
Interest Rate
5.8%
Mortgage Type
Purchase Money Mortgage
Purchase Details
Closed on
Aug 9, 1995
Bought by
Organek Gary E
Create a Home Valuation Report for This Property
The Home Valuation Report is an in-depth analysis detailing your home's value as well as a comparison with similar homes in the area
Home Values in the Area
Average Home Value in this Area
Purchase History
| Date | Buyer | Sale Price | Title Company |
|---|---|---|---|
| Wood Leaf Townhomes Llc | -- | None Available | |
| Maniaci Charles G | -- | None Available | |
| Wood Leaf Townhouses Llc | -- | None Available | |
| Manivest Llc | -- | None Available | |
| Maniaci Charles G | $395,000 | -- | |
| Organek Gary E | $224,000 | -- |
Source: Public Records
Mortgage History
| Date | Status | Borrower | Loan Amount |
|---|---|---|---|
| Previous Owner | Maniaci Charles G | $296,250 |
Source: Public Records
Tax History Compared to Growth
Tax History
| Year | Tax Paid | Tax Assessment Tax Assessment Total Assessment is a certain percentage of the fair market value that is determined by local assessors to be the total taxable value of land and additions on the property. | Land | Improvement |
|---|---|---|---|---|
| 2025 | $11,264 | $240,900 | $31,200 | $209,700 |
| 2024 | $50 | $193,600 | $28,800 | $164,800 |
| 2023 | $10,667 | $178,300 | $27,700 | $150,600 |
| 2022 | $10,153 | $162,700 | $24,400 | $138,300 |
| 2021 | $9,924 | $154,900 | $22,000 | $132,900 |
| 2020 | $9,767 | $150,300 | $22,000 | $128,300 |
| 2019 | $9,486 | $142,900 | $26,600 | $116,300 |
| 2018 | $9,110 | $140,000 | $18,700 | $121,300 |
| 2017 | $8,717 | $135,000 | $19,300 | $115,700 |
| 2016 | $4,705 | $131,200 | $17,100 | $114,100 |
| 2015 | $4,705 | $124,800 | $37,000 | $87,800 |
| 2014 | $4,705 | $148,500 | $30,273 | $118,227 |
Source: Public Records
Map
Nearby Homes
- 2083 Fox Hollow Dr
- 3740 Cavalier Dr Unit 2
- 2302 Fieldstone Dr
- 3675 E Meadows Ct Unit 58
- 2073 Birch Bluff Dr
- 2024 Belwood Dr
- 2020 Tamarack Dr
- 3588 Autumnwood Ln
- 1995 Belwood Dr
- 2150 Heritage Ave
- 3782 Thistlewood Rd
- 3660 Powderhorn Dr
- 2184 Belding Ct
- 3720 Crane Cir
- 3732 Crane Cir
- 3738 Crane Cir
- 3729 Crane Cir
- 3735 Crane Cir
- 2452 Turning Leaf Ln
- 3890 Pine Knoll Dr
- 0 Woodleaf Ct
- 2181 Woodleaf St
- 2159 Woodleaf St
- 2163 Woodleaf Ct
- 2174 Woodleaf Ct
- 2174 Woodleaf St
- 2176 Woodleaf St
- 2144 Woodleaf St
- 2186 Woodleaf St
- 2147 Woodleaf St
- 2210 Woodleaf Ct
- 2193 Woodleaf Ct
- 2210 Woodleaf St
- 2177 Fox Hollow Dr
- 2193 Woodleaf St
- 2137 Woodleaf St
- 2137 Woodleaf Ct
- 2137 Fox Hollow Dr
- 2197 Fox Hollow Dr
- 2093 Fox Hollow Dr Unit 69