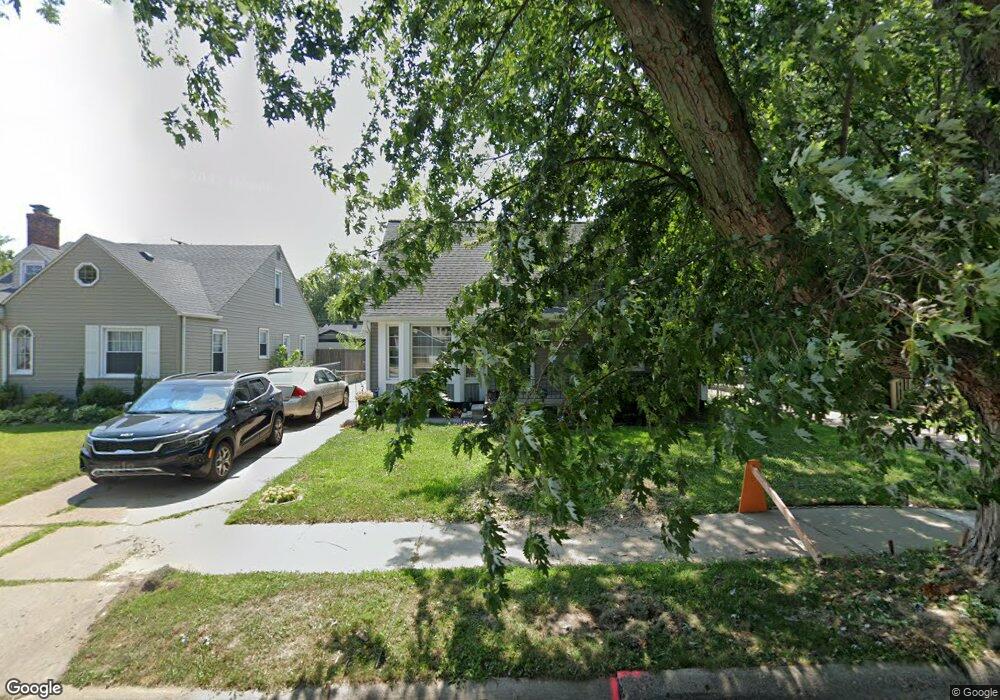
21714 Gaukler St Saint Clair Shores, MI 48080
Estimated Value: $188,000 - $227,000
3
Beds
1
Bath
1,250
Sq Ft
$167/Sq Ft
Est. Value
About This Home
This home is located at 21714 Gaukler St, Saint Clair Shores, MI 48080 and is currently estimated at $208,433, approximately $166 per square foot. 21714 Gaukler St is a home located in Macomb County with nearby schools including South Lake Middle School, South Lake High School, and St. Joan of Arc Elementary School.
Ownership History
Date
Name
Owned For
Owner Type
Purchase Details
Closed on
Oct 5, 2022
Sold by
Greschak Timothy J
Bought by
Greschak Timothy J and Greschak Jessica Ann
Current Estimated Value
Home Financials for this Owner
Home Financials are based on the most recent Mortgage that was taken out on this home.
Original Mortgage
$156,695
Outstanding Balance
$150,628
Interest Rate
5.89%
Mortgage Type
FHA
Estimated Equity
$57,805
Purchase Details
Closed on
Nov 3, 2008
Sold by
Delvecchio Family Living Trust
Bought by
Greschak Timothy J
Home Financials for this Owner
Home Financials are based on the most recent Mortgage that was taken out on this home.
Original Mortgage
$106,953
Interest Rate
6.11%
Mortgage Type
FHA
Purchase Details
Closed on
Apr 17, 1997
Sold by
Delvecchio William J and Delvecchio Helen
Bought by
Delvecchio William J and Delvecchio Helen L
Create a Home Valuation Report for This Property
The Home Valuation Report is an in-depth analysis detailing your home's value as well as a comparison with similar homes in the area
Home Values in the Area
Average Home Value in this Area
Purchase History
| Date | Buyer | Sale Price | Title Company |
|---|---|---|---|
| Greschak Timothy J | -- | -- | |
| Greschak Timothy J | $108,900 | Homeowners Title Agency | |
| Delvecchio William J | -- | None Available |
Source: Public Records
Mortgage History
| Date | Status | Borrower | Loan Amount |
|---|---|---|---|
| Open | Greschak Timothy J | $156,695 | |
| Previous Owner | Greschak Timothy J | $106,953 |
Source: Public Records
Tax History Compared to Growth
Tax History
| Year | Tax Paid | Tax Assessment Tax Assessment Total Assessment is a certain percentage of the fair market value that is determined by local assessors to be the total taxable value of land and additions on the property. | Land | Improvement |
|---|---|---|---|---|
| 2025 | $2,342 | $93,700 | $0 | $0 |
| 2024 | $2,342 | $89,100 | $0 | $0 |
| 2023 | $2,230 | $78,500 | $0 | $0 |
| 2022 | $2,070 | $68,300 | $0 | $0 |
| 2021 | $2,168 | $63,300 | $0 | $0 |
| 2020 | $2,177 | $59,200 | $0 | $0 |
| 2019 | $1,833 | $52,400 | $0 | $0 |
| 2018 | $2,046 | $42,700 | $0 | $0 |
| 2017 | $1,975 | $41,100 | $5,200 | $35,900 |
| 2016 | $1,833 | $41,100 | $0 | $0 |
| 2015 | $1,801 | $38,400 | $0 | $0 |
| 2013 | -- | $38,200 | $0 | $0 |
| 2012 | -- | $37,500 | $6,100 | $31,400 |
Source: Public Records
Map
Nearby Homes
- 21813 Rosedale St
- 21722 Rosedale St
- 21831 California St
- 21813 Sunnyside St
- 22017 Rosedale St
- 20624 Sunnyside St
- 20618 Sunnyside St
- 20707 Elizabeth St
- 22130 Mauer St
- 20505 Shady Lane Ave
- 21816 Oconnor St
- 21820 Oconnor St
- 22859 Grove St Unit 53
- 22417 Maxine St
- 20308 Shady Lane Ave
- 20406 Mauer St
- 21824 Colony St
- 22417 Carolina St
- 22425 Saint Joan St
- 21618 Woodbridge St
- 21710 Gaukler St
- 21720 Gaukler St
- 21726 Gaukler St
- 21706 Gaukler St
- 21707 Alger St
- 21721 Alger St
- 21705 Alger St
- 21700 Gaukler St
- 21800 Gaukler St
- 21711 Gaukler St
- 21721 Gaukler St
- 21707 Gaukler St
- 21723 Gaukler St
- 21801 Alger St
- 21701 Alger St
- 21705 Gaukler St
- 21620 Gaukler St
- 21808 Gaukler St
- 21723 Gaulker
- 21801 Gaukler St