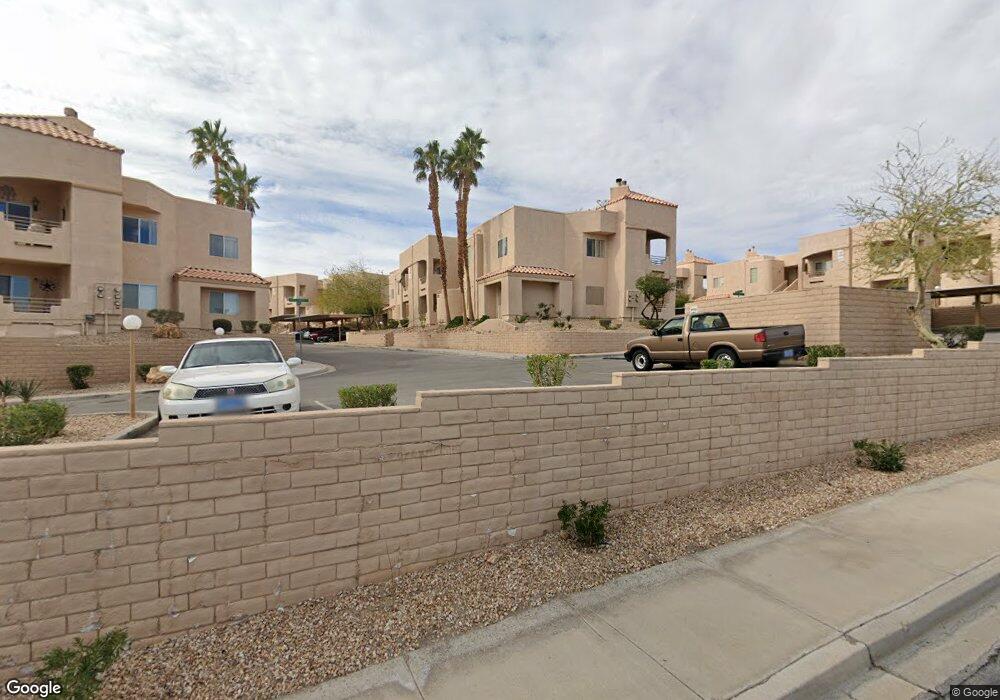
2172 Aspen Mirror Way Unit 103 Laughlin, NV 89029
Estimated Value: $138,722 - $155,000
2
Beds
2
Baths
900
Sq Ft
$165/Sq Ft
Est. Value
About This Home
This home is located at 2172 Aspen Mirror Way Unit 103, Laughlin, NV 89029 and is currently estimated at $148,681, approximately $165 per square foot. 2172 Aspen Mirror Way Unit 103 is a home located in Clark County with nearby schools including William G. Bennett Elementary School.
Ownership History
Date
Name
Owned For
Owner Type
Purchase Details
Closed on
Apr 28, 2016
Sold by
Cojstello Ella L
Bought by
Nissen James Paul
Current Estimated Value
Home Financials for this Owner
Home Financials are based on the most recent Mortgage that was taken out on this home.
Original Mortgage
$50,000
Outstanding Balance
$22,100
Interest Rate
3.59%
Mortgage Type
New Conventional
Estimated Equity
$126,581
Purchase Details
Closed on
May 5, 2004
Sold by
Saunders Willie
Bought by
Costello Ella L
Home Financials for this Owner
Home Financials are based on the most recent Mortgage that was taken out on this home.
Original Mortgage
$61,500
Interest Rate
5.5%
Mortgage Type
Unknown
Purchase Details
Closed on
Apr 8, 2003
Sold by
Costello Ella
Bought by
Costello Ella Louise and The Ella Louise Costello Trust
Create a Home Valuation Report for This Property
The Home Valuation Report is an in-depth analysis detailing your home's value as well as a comparison with similar homes in the area
Home Values in the Area
Average Home Value in this Area
Purchase History
| Date | Buyer | Sale Price | Title Company |
|---|---|---|---|
| Nissen James Paul | $71,000 | Chicago Title Mohave | |
| Costello Ella L | -- | United Title Of Nevada | |
| Costello Ella L | -- | United Title Of Nevada | |
| Costello Ella Louise | -- | -- |
Source: Public Records
Mortgage History
| Date | Status | Borrower | Loan Amount |
|---|---|---|---|
| Open | Nissen James Paul | $50,000 | |
| Previous Owner | Costello Ella L | $61,500 |
Source: Public Records
Tax History Compared to Growth
Tax History
| Year | Tax Paid | Tax Assessment Tax Assessment Total Assessment is a certain percentage of the fair market value that is determined by local assessors to be the total taxable value of land and additions on the property. | Land | Improvement |
|---|---|---|---|---|
| 2025 | $708 | $27,886 | $8,400 | $19,486 |
| 2024 | $687 | $27,886 | $8,400 | $19,486 |
| 2023 | $553 | $34,699 | $16,450 | $18,249 |
| 2022 | $667 | $30,649 | $13,650 | $16,999 |
| 2021 | $648 | $27,788 | $11,200 | $16,588 |
| 2020 | $627 | $27,421 | $10,850 | $16,571 |
| 2019 | $619 | $25,318 | $8,750 | $16,568 |
| 2018 | $591 | $22,213 | $5,950 | $16,263 |
| 2017 | $736 | $21,971 | $5,250 | $16,721 |
| 2016 | $553 | $21,216 | $5,250 | $15,966 |
| 2015 | $552 | $20,100 | $5,250 | $14,850 |
| 2014 | $536 | $15,529 | $7,000 | $8,529 |
Source: Public Records
Map
Nearby Homes
- 2160 Highpointe Dr Unit 102
- 2180 Highpointe Dr Unit 203
- 2173 Aspen Mirror Way Unit 101
- 2192 Aspen Mirror Way Unit 102
- 2219 Rugged Mesa Dr
- 2200 Highpointe Dr Unit 201
- 2223 Rugged Mesa Dr
- 2157 Camel Mesa Dr
- 2232 Aspen Mirror Way Unit 204
- 2232 Aspen Mirror Way Unit 202
- 2260 Rugged Mesa Dr
- 2240 Highpointe Dr Unit 203
- 2176 Camel Mesa Dr
- 2194 Camel Mesa Dr
- 2243 Aspen Mirror Way Unit 102
- 2297 Camel Mesa Dr
- 2191 Bay Club Dr Unit 102
- 2926 Shimmering Bay St
- 2865 Rippling Springs St
- 2221 Bay Club Dr Unit 202
- 2172 Aspen Mirror Way Unit 204
- 2172 Aspen Mirror Way Unit 201
- 2172 Aspen Mirror Way Unit 202
- 2172 Aspen Mirror Way Unit 104
- 2172 Aspen Mirror Way Unit 203
- 2172 Aspen Mirror Way Unit 101
- 2172 Aspen Mirror Way Unit 102
- 2172 Aspen Mirror Way
- 2173 Aspen Mirror Way Unit 103
- 2173 Aspen Mirror Way Unit 102
- 2173 Aspen Mirror Way Unit 201
- 2173 Aspen Mirror Way Unit 203
- 2173 Aspen Mirror Way Unit 202
- 2173 Aspen Mirror Way Unit 204
- 2173 Aspen Mirror Way Unit 104
- 2173 Aspen Mirror Way
- 2160 Highpointe Dr Unit 204
- 2160 Highpointe Dr Unit 203
- 2160 Highpointe Dr Unit 202
- 2160 Highpointe Dr Unit 101