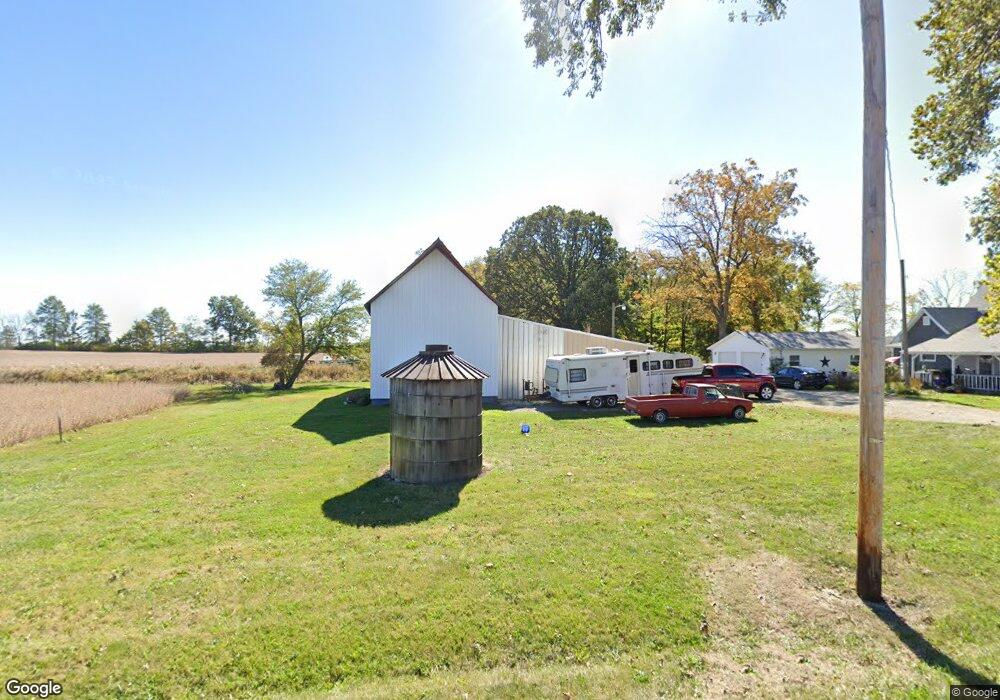
2172 E 500 N Hartford City, IN 47348
Estimated Value: $234,000 - $303,953
3
Beds
1
Bath
1,923
Sq Ft
$140/Sq Ft
Est. Value
About This Home
This home is located at 2172 E 500 N, Hartford City, IN 47348 and is currently estimated at $269,318, approximately $140 per square foot. 2172 E 500 N is a home located in Blackford County with nearby schools including Hoosier Prairie Elementary School, Francis Vigo Elementary School, and Montpelier School.
Ownership History
Date
Name
Owned For
Owner Type
Purchase Details
Closed on
Mar 5, 2014
Sold by
Sleppy Nellie Mae and Sleppy Nellie M
Bought by
Sleppy Nellie M and Nellie M Sleppy Trust
Current Estimated Value
Purchase Details
Closed on
Dec 13, 2013
Sold by
Sleppy Nellie Mae
Bought by
Benedict Amy J
Purchase Details
Closed on
Sep 30, 2013
Sold by
Sleppy Nellie Mae and Sleppy Joseph Samuel
Bought by
Sleppy Nellie Mae
Purchase Details
Closed on
Jan 23, 2008
Sold by
Sleppy Joe S and Sleppy Nellie Mae
Bought by
Sleppy Joseph Samuel and Sleppy Nellie Mae
Purchase Details
Closed on
Sep 28, 2006
Sold by
Leas Cathy D
Bought by
Sleppy Joe S and Sleeppy Nellie
Home Financials for this Owner
Home Financials are based on the most recent Mortgage that was taken out on this home.
Original Mortgage
$69,700
Interest Rate
6.58%
Mortgage Type
Unknown
Create a Home Valuation Report for This Property
The Home Valuation Report is an in-depth analysis detailing your home's value as well as a comparison with similar homes in the area
Home Values in the Area
Average Home Value in this Area
Purchase History
| Date | Buyer | Sale Price | Title Company |
|---|---|---|---|
| Sleppy Nellie M | -- | None Available | |
| Benedict Amy J | -- | None Available | |
| Sleppy Nellie Mae | -- | None Available | |
| Sleppy Nellie Mae | -- | None Available | |
| Sleppy Joseph Samuel | -- | None Available | |
| Sleppy Joe S | -- | None Available |
Source: Public Records
Mortgage History
| Date | Status | Borrower | Loan Amount |
|---|---|---|---|
| Previous Owner | Sleppy Joe S | $69,700 |
Source: Public Records
Tax History Compared to Growth
Tax History
| Year | Tax Paid | Tax Assessment Tax Assessment Total Assessment is a certain percentage of the fair market value that is determined by local assessors to be the total taxable value of land and additions on the property. | Land | Improvement |
|---|---|---|---|---|
| 2024 | $1,949 | $185,800 | $41,800 | $144,000 |
| 2023 | $1,589 | $160,300 | $31,200 | $129,100 |
| 2022 | $1,466 | $133,900 | $26,700 | $107,200 |
| 2021 | $1,173 | $112,400 | $24,400 | $88,000 |
| 2020 | $1,114 | $110,600 | $24,300 | $86,300 |
| 2019 | $1,123 | $109,400 | $27,400 | $82,000 |
| 2018 | $1,180 | $113,700 | $28,000 | $85,700 |
| 2017 | $1,192 | $117,500 | $30,600 | $86,900 |
| 2016 | $1,201 | $116,700 | $31,900 | $84,800 |
| 2014 | $944 | $101,200 | $32,900 | $68,300 |
| 2013 | $944 | $85,600 | $29,600 | $56,000 |
Source: Public Records
Map
Nearby Homes
- 6281 N 300 E
- 0 County Road 300 N
- 7656 N 200 E
- 2141 N 100 E
- 532 W Green St
- Corner of 400 N & 700 Rd E
- 435 W High St
- 404 W Huntington St
- 512 W Plate Glass St
- 126 W Windsor St
- 103 S Washington St
- 109 E Water St
- 222 N Adams St
- 1420 N 100 E
- 6970 N 100 W
- 1010 W State Road 18
- 402 E Hickory Grove Rd
- 100 Ivy Ln
- 1333 N Mill St
- 1208 N Mulberry St