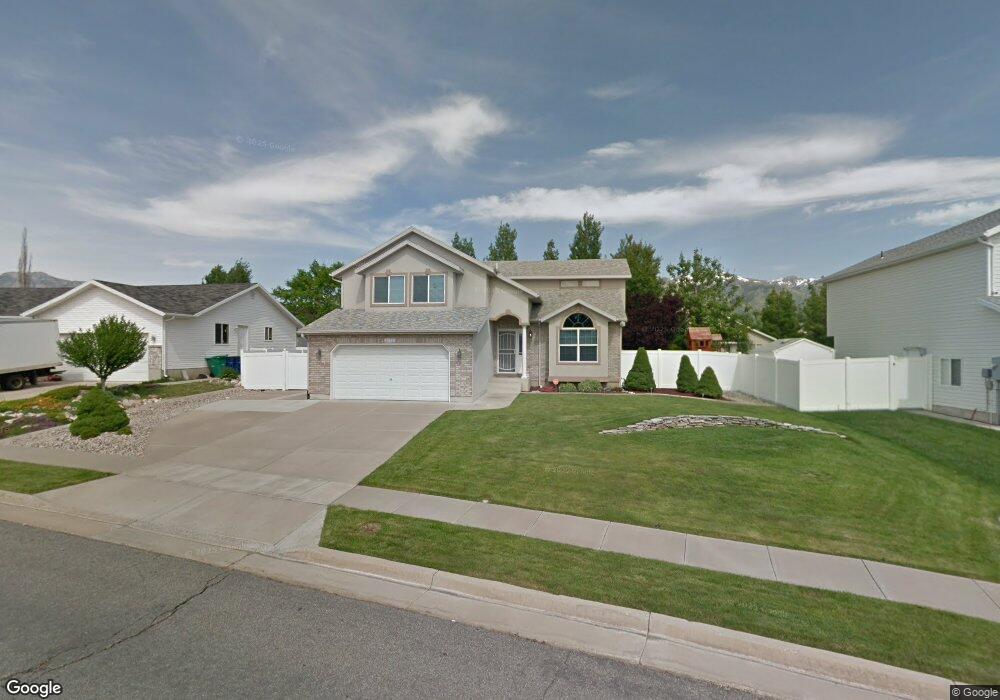
2172 N 50 W Layton, UT 84041
Estimated Value: $531,200 - $583,000
4
Beds
4
Baths
2,289
Sq Ft
$241/Sq Ft
Est. Value
About This Home
This home is located at 2172 N 50 W, Layton, UT 84041 and is currently estimated at $551,550, approximately $240 per square foot. 2172 N 50 W is a home located in Davis County with nearby schools including Lincoln Elementary School, North Layton Junior High School, and Northridge High School.
Ownership History
Date
Name
Owned For
Owner Type
Purchase Details
Closed on
May 1, 2020
Sold by
Shepherd Kristine M and Davis Kristine Wieber
Bought by
Wieber Kristine
Current Estimated Value
Home Financials for this Owner
Home Financials are based on the most recent Mortgage that was taken out on this home.
Original Mortgage
$289,500
Outstanding Balance
$256,944
Interest Rate
3.5%
Mortgage Type
New Conventional
Estimated Equity
$294,606
Purchase Details
Closed on
Dec 7, 2018
Sold by
Joubert Anthony R and Joubert Debra K
Bought by
Shepherd Kristine M
Home Financials for this Owner
Home Financials are based on the most recent Mortgage that was taken out on this home.
Original Mortgage
$290,000
Interest Rate
4.8%
Mortgage Type
New Conventional
Purchase Details
Closed on
Aug 28, 1998
Sold by
Burmingham Construction Inc
Bought by
Joubert Anthony R and Joubert Debra K
Purchase Details
Closed on
Nov 21, 1997
Sold by
Wasatch West Lc
Bought by
Burningham Construction Inc
Create a Home Valuation Report for This Property
The Home Valuation Report is an in-depth analysis detailing your home's value as well as a comparison with similar homes in the area
Home Values in the Area
Average Home Value in this Area
Purchase History
| Date | Buyer | Sale Price | Title Company |
|---|---|---|---|
| Wieber Kristine | -- | Gt Title Services Salt | |
| Shepherd Kristine M | -- | Metro National Titl | |
| Joubert Anthony R | -- | First American Title Co | |
| Burningham Construction Inc | -- | Bonneville Title Company Inc |
Source: Public Records
Mortgage History
| Date | Status | Borrower | Loan Amount |
|---|---|---|---|
| Open | Wieber Kristine | $289,500 | |
| Previous Owner | Shepherd Kristine M | $290,000 |
Source: Public Records
Tax History Compared to Growth
Tax History
| Year | Tax Paid | Tax Assessment Tax Assessment Total Assessment is a certain percentage of the fair market value that is determined by local assessors to be the total taxable value of land and additions on the property. | Land | Improvement |
|---|---|---|---|---|
| 2025 | $2,800 | $271,150 | $105,228 | $165,922 |
| 2024 | $2,645 | $259,600 | $122,416 | $137,184 |
| 2023 | $2,686 | $470,000 | $143,730 | $326,270 |
| 2022 | $2,756 | $263,450 | $76,530 | $186,920 |
| 2021 | $2,528 | $360,000 | $108,783 | $251,217 |
| 2020 | $2,303 | $314,000 | $90,928 | $223,072 |
| 2019 | $2,191 | $294,000 | $85,813 | $208,187 |
| 2018 | $1,891 | $254,000 | $85,813 | $168,187 |
| 2016 | $1,809 | $127,765 | $27,807 | $99,958 |
| 2015 | $1,828 | $123,365 | $27,807 | $95,558 |
| 2014 | $1,827 | $126,813 | $27,807 | $99,006 |
| 2013 | -- | $114,444 | $31,020 | $83,424 |
Source: Public Records
Map
Nearby Homes
- 9 W 2150 N
- 23 E 2150 N
- 2048 Evans Cove Loop
- 2044 Evans Cove Loop
- 2053 Evans Cove Loop Unit 39
- 95 W 2400 N
- 1908 N 200 W
- 2500 N Fort Ln Unit 189
- 2500 N Fort Ln Unit 238
- 2600 N Hill Field Rd Unit 4
- 2248 N 500 W
- 506 W 2200 N
- 2211 N 525 W
- 1837 N 440 W
- 1583 N 25 E
- 398 Paul Ave
- 14 Lakeview Dr
- 265 Mindella Way
- 254 Fremont Way
- 1553 N 250 E