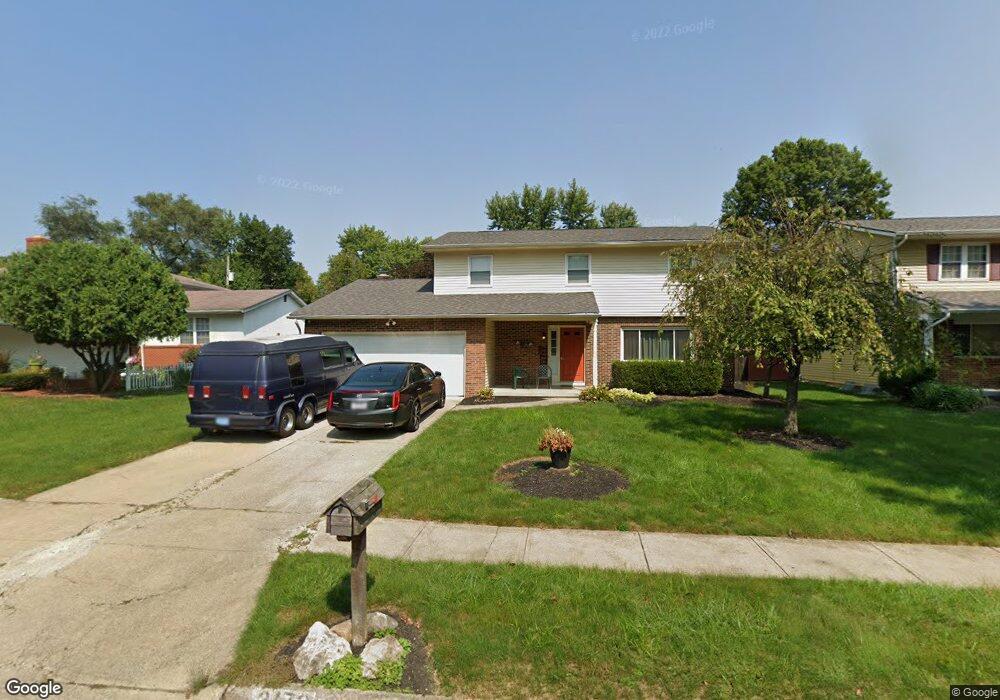
2172 Yellow Pine Ave Columbus, OH 43229
Forest Park East NeighborhoodEstimated Value: $307,000 - $357,000
4
Beds
3
Baths
1,880
Sq Ft
$176/Sq Ft
Est. Value
About This Home
This home is located at 2172 Yellow Pine Ave, Columbus, OH 43229 and is currently estimated at $331,440, approximately $176 per square foot. 2172 Yellow Pine Ave is a home located in Franklin County with nearby schools including Avalon Elementary School, Northgate Intermediate, and Woodward Park Middle School.
Ownership History
Date
Name
Owned For
Owner Type
Purchase Details
Closed on
Dec 8, 2015
Sold by
Rubin Jody K
Bought by
Sachs Timothy A and Sachs Sakeya M
Current Estimated Value
Home Financials for this Owner
Home Financials are based on the most recent Mortgage that was taken out on this home.
Original Mortgage
$5,750
Outstanding Balance
$4,536
Interest Rate
3.96%
Mortgage Type
Stand Alone Second
Estimated Equity
$326,904
Purchase Details
Closed on
Jul 27, 2011
Sold by
Forbes Douglas T and Forbes Stephanie L
Bought by
Rubin Jody K
Home Financials for this Owner
Home Financials are based on the most recent Mortgage that was taken out on this home.
Original Mortgage
$107,211
Interest Rate
4.52%
Mortgage Type
FHA
Purchase Details
Closed on
Aug 26, 1998
Sold by
Kaye Dennis E and Kaye Dolores K
Bought by
Forbes Douglas T and Forbes Stephen L
Purchase Details
Closed on
May 1, 1984
Create a Home Valuation Report for This Property
The Home Valuation Report is an in-depth analysis detailing your home's value as well as a comparison with similar homes in the area
Home Values in the Area
Average Home Value in this Area
Purchase History
| Date | Buyer | Sale Price | Title Company |
|---|---|---|---|
| Sachs Timothy A | $115,000 | Attorney | |
| Rubin Jody K | $110,000 | Talon Group | |
| Forbes Douglas T | $122,500 | -- | |
| -- | $72,900 | -- |
Source: Public Records
Mortgage History
| Date | Status | Borrower | Loan Amount |
|---|---|---|---|
| Open | Sachs Timothy A | $5,750 | |
| Open | Sachs Timothy A | $112,917 | |
| Previous Owner | Rubin Jody K | $107,211 |
Source: Public Records
Tax History
| Year | Tax Paid | Tax Assessment Tax Assessment Total Assessment is a certain percentage of the fair market value that is determined by local assessors to be the total taxable value of land and additions on the property. | Land | Improvement |
|---|---|---|---|---|
| 2025 | $4,330 | $96,470 | $20,410 | $76,060 |
| 2024 | $4,330 | $96,470 | $20,410 | $76,060 |
| 2023 | $4,274 | $96,460 | $20,405 | $76,055 |
| 2022 | $3,166 | $61,050 | $13,760 | $47,290 |
| 2021 | $3,172 | $61,050 | $13,760 | $47,290 |
| 2020 | $3,176 | $61,050 | $13,760 | $47,290 |
| 2019 | $2,604 | $42,920 | $10,190 | $32,730 |
| 2018 | $2,521 | $42,920 | $10,190 | $32,730 |
| 2017 | $2,647 | $42,920 | $10,190 | $32,730 |
| 2016 | $2,692 | $40,640 | $9,590 | $31,050 |
| 2015 | $2,444 | $40,640 | $9,590 | $31,050 |
| 2014 | $2,450 | $40,640 | $9,590 | $31,050 |
| 2013 | $1,272 | $42,770 | $10,080 | $32,690 |
Source: Public Records
Map
Nearby Homes
- 5177 Avalon Ave
- 2087 Teakwood Dr
- 2251 Tuliptree Ave
- 1862 Torchwood Dr
- 5603 Maple Canyon Ave
- 5556 Parkshire Dr Unit 5556
- 2027 Shawbury Ct W
- 2162 Trent Rd
- 5092 Riverbirch Dr N
- 5486 Pine Bluff Rd
- 5726 Beechcroft Rd Unit J
- 2655 Minerva Lake Rd
- 5732 Beechcroft Rd Unit B
- 5720 Beechcroft Rd Unit B
- 2414 Taymouth Rd
- 1638 Arrowood Loop N
- 2830 Minerva Ave
- 5705 Pine Tree St S Unit F
- 1687 Brookfield Square S
- 4687 Larkhall Ln
- 2180 Yellow Pine Ave
- 2164 Yellow Pine Ave
- 2190 Yellow Pine Ave
- 2173 Pine Knoll Ave
- 2152 Yellow Pine Ave
- 2181 Pine Knoll Ave
- 2163 Pine Knoll Ave
- 2191 Pine Knoll Ave
- 2181 Yellow Pine Ave
- 2153 Pine Knoll Ave
- 2161 Yellow Pine Ave
- 2198 Yellow Pine Ave
- 2144 Yellow Pine Ave
- 2191 Yellow Pine Ave
- 2153 Yellow Pine Ave
- 2199 Pine Knoll Ave
- 2145 Pine Knoll Ave
- 2208 Yellow Pine Ave
- 2199 Yellow Pine Ave
- 2134 Yellow Pine Ave
Your Personal Tour Guide
Ask me questions while you tour the home.