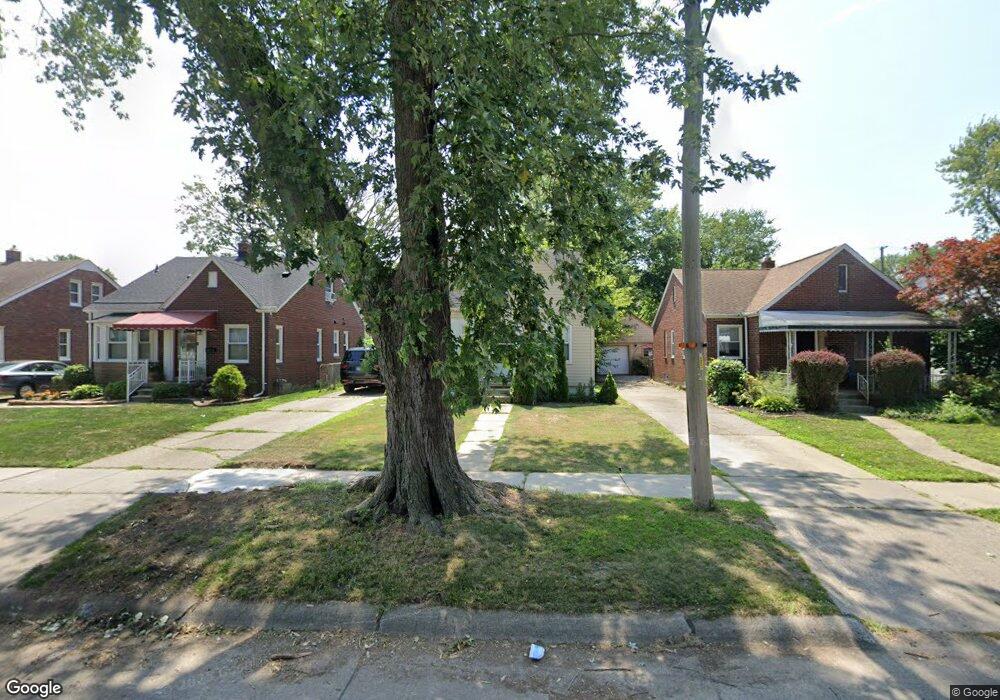
21728 Colony St Saint Clair Shores, MI 48080
Estimated Value: $172,746 - $200,000
2
Beds
1
Bath
800
Sq Ft
$234/Sq Ft
Est. Value
About This Home
This home is located at 21728 Colony St, Saint Clair Shores, MI 48080 and is currently estimated at $187,187, approximately $233 per square foot. 21728 Colony St is a home located in Macomb County with nearby schools including South Lake Middle School, South Lake High School, and St. Joan of Arc Elementary School.
Ownership History
Date
Name
Owned For
Owner Type
Purchase Details
Closed on
Jul 15, 2022
Sold by
Paske Homes Inc
Bought by
Mcp Realty Holdings Llc
Current Estimated Value
Purchase Details
Closed on
Aug 5, 2016
Sold by
Paske Ronald S and Paske Mary C
Bought by
Paske Homes Inc
Purchase Details
Closed on
Aug 3, 2016
Sold by
Federal Home Loan Mortgage Corporatio
Bought by
Paske Mary C and Paske Ronald S
Purchase Details
Closed on
Jan 11, 2016
Sold by
Colonial Savings Fa
Bought by
Federal Home Loan Mortgage Corporation
Purchase Details
Closed on
Jun 19, 2015
Sold by
Picard Louise
Bought by
Colonial Savings F A
Purchase Details
Closed on
Jul 28, 2006
Sold by
Corbett Marilyn
Bought by
Stewart Patricia M and Picard Louise
Purchase Details
Closed on
May 6, 1999
Sold by
Sanders Mary M Aka
Bought by
Corbett Marilyn
Purchase Details
Closed on
Aug 30, 1996
Sold by
Folino L
Bought by
Veneri J
Create a Home Valuation Report for This Property
The Home Valuation Report is an in-depth analysis detailing your home's value as well as a comparison with similar homes in the area
Home Values in the Area
Average Home Value in this Area
Purchase History
| Date | Buyer | Sale Price | Title Company |
|---|---|---|---|
| Mcp Realty Holdings Llc | -- | None Listed On Document | |
| Paske Homes Inc | -- | None Available | |
| Paske Mary C | $52,000 | -- | |
| Federal Home Loan Mortgage Corporation | -- | Attorney | |
| Colonial Savings F A | $73,000 | Attorney | |
| Stewart Patricia M | $120,000 | Metropolitan Title Company | |
| Corbett Marilyn | $102,000 | -- | |
| Veneri J | $77,300 | -- |
Source: Public Records
Tax History Compared to Growth
Tax History
| Year | Tax Paid | Tax Assessment Tax Assessment Total Assessment is a certain percentage of the fair market value that is determined by local assessors to be the total taxable value of land and additions on the property. | Land | Improvement |
|---|---|---|---|---|
| 2025 | $3,271 | $83,400 | $0 | $0 |
| 2024 | $3,271 | $79,300 | $0 | $0 |
| 2023 | $2,985 | $69,700 | $0 | $0 |
| 2022 | $3,237 | $60,900 | $0 | $0 |
| 2021 | $2,860 | $56,500 | $0 | $0 |
| 2020 | $2,788 | $52,100 | $0 | $0 |
| 2019 | $2,676 | $44,500 | $0 | $0 |
| 2018 | $2,548 | $38,600 | $0 | $0 |
| 2017 | $2,548 | $37,200 | $4,500 | $32,700 |
| 2016 | $2,051 | $37,200 | $0 | $0 |
| 2015 | $2,140 | $34,600 | $0 | $0 |
| 2013 | -- | $32,800 | $0 | $0 |
| 2012 | -- | $32,200 | $5,300 | $26,900 |
Source: Public Records
Map
Nearby Homes
- 21716 Lakeview St
- 22121 Englehardt St
- 20707 Elizabeth St
- 21701 Pleasant St
- 22035 Lakeview St
- 21730 Grand Lake St
- 22859 Grove St Unit 53
- 22843 Grove St Unit 47
- 21612 Harper Lake Ave
- 21597 Harper Lake Ave
- 20615 California St
- 22115 Harper Lake Ave
- 21715 Alger St
- 20690 California St
- 22503 Clairwood St
- 22410 Glen Ct
- 21615 Ridgeway St
- 22109 Alger St
- 22520 Liberty St
- 22026 Alger St
- 21724 Colony St
- 21734 Colony St
- 21720 Colony St
- 21804 Colony St
- 21808 Colony St
- 21716 Colony St
- 21801 Oconnor St
- 21721 Oconnor St
- 21812 Colony St
- 21712 Colony St
- 21715 O'Connor St
- 21805 Oconnor St
- 21715 Oconnor St
- 21816 Colony St
- 21811 Oconnor St
- 21708 Colony St
- 21704 Colony St
- 21731 Colony St
- 21711 Oconnor St
- 21727 Colony St