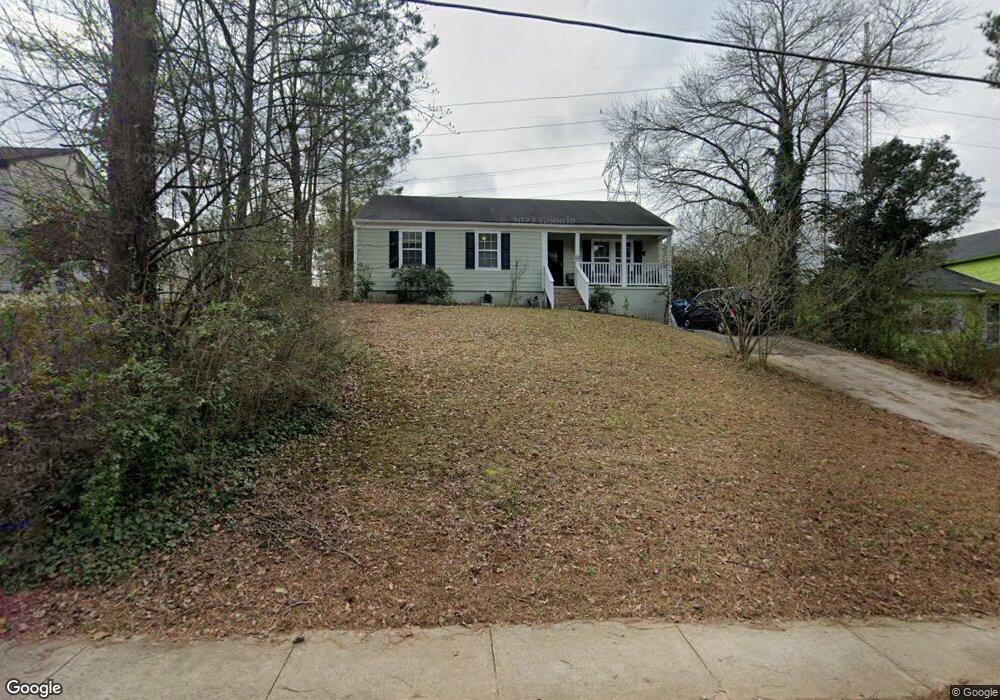
2174 Newbury Rd Norcross, GA 30071
Estimated Value: $299,000 - $348,000
3
Beds
2
Baths
1,218
Sq Ft
$264/Sq Ft
Est. Value
About This Home
This home is located at 2174 Newbury Rd, Norcross, GA 30071 and is currently estimated at $321,207, approximately $263 per square foot. 2174 Newbury Rd is a home located in Gwinnett County with nearby schools including Norcross Elementary School, Summerour Middle School, and Norcross High School.
Ownership History
Date
Name
Owned For
Owner Type
Purchase Details
Closed on
Apr 7, 2011
Sold by
Foreclosure Cleanup Specialist
Bought by
Guzman Maria E
Current Estimated Value
Home Financials for this Owner
Home Financials are based on the most recent Mortgage that was taken out on this home.
Original Mortgage
$70,700
Outstanding Balance
$48,585
Interest Rate
4.87%
Mortgage Type
FHA
Estimated Equity
$272,622
Purchase Details
Closed on
Jan 5, 2010
Sold by
Grey Street Homes Llc
Bought by
Foreclosure Cleanup Specialist
Purchase Details
Closed on
Apr 28, 1998
Sold by
Phan Hung M
Bought by
Bailey Phal S and Bailey David L
Home Financials for this Owner
Home Financials are based on the most recent Mortgage that was taken out on this home.
Original Mortgage
$68,400
Interest Rate
7.03%
Mortgage Type
New Conventional
Create a Home Valuation Report for This Property
The Home Valuation Report is an in-depth analysis detailing your home's value as well as a comparison with similar homes in the area
Home Values in the Area
Average Home Value in this Area
Purchase History
| Date | Buyer | Sale Price | Title Company |
|---|---|---|---|
| Guzman Maria E | $74,000 | -- | |
| Foreclosure Cleanup Specialist | -- | -- | |
| Grey Street Homes Llc | $37,761 | -- | |
| Bailey Phal S | $72,000 | -- |
Source: Public Records
Mortgage History
| Date | Status | Borrower | Loan Amount |
|---|---|---|---|
| Open | Guzman Maria E | $70,700 | |
| Previous Owner | Bailey Phal S | $68,400 |
Source: Public Records
Tax History Compared to Growth
Tax History
| Year | Tax Paid | Tax Assessment Tax Assessment Total Assessment is a certain percentage of the fair market value that is determined by local assessors to be the total taxable value of land and additions on the property. | Land | Improvement |
|---|---|---|---|---|
| 2025 | $2,445 | $114,960 | $25,840 | $89,120 |
| 2024 | $2,410 | $107,480 | $21,600 | $85,880 |
| 2023 | $2,410 | $107,480 | $21,600 | $85,880 |
| 2022 | $2,023 | $88,240 | $21,600 | $66,640 |
| 2021 | $1,627 | $66,880 | $14,840 | $52,040 |
| 2020 | $1,644 | $66,880 | $14,840 | $52,040 |
| 2019 | $2,150 | $63,000 | $14,000 | $49,000 |
| 2018 | $1,245 | $48,200 | $10,000 | $38,200 |
| 2016 | $1,298 | $50,480 | $10,000 | $40,480 |
| 2015 | $1,535 | $34,000 | $8,000 | $26,000 |
| 2014 | -- | $37,080 | $8,000 | $29,080 |
Source: Public Records
Map
Nearby Homes
- 5341 Goodwick Way
- 2199 Summertown Dr
- 5381 Station Cir Unit 3
- 5457 Rails Way
- 5477 Windy Creek Ln
- 5479 Windy Creek Ln
- 2009 Hoot Owl Trail
- 2066 Pinnacle Pointe Dr
- 4242 Morrison Lake Trail
- 2375 Beaver Falls Dr
- 2340 Beaver Ruin Rd Unit 26
- 2340 Beaver Ruin Rd Unit 41
- 2340 Beaver Ruin Rd
- 2340 Beaver Ruin Rd Unit 15
- 2340 Beaver Ruin Rd Unit 16
- 5364 Hickory Knoll
- 5358 Beaver Branch
- 5357 Beaver Branch
- 2037 Pinnacle Pointe Dr
- 2325 E Hill Way NW
- 2168 Newbury Rd
- 2180 Newbury Rd
- 2162 Newbury Rd
- 2186 Newbury Rd
- 2173 Newbury Rd
- 2167 Newbury Rd
- 2156 Newbury Rd
- 2192 Newbury Rd Unit 1
- 2161 Newbury Rd Unit 1
- 2150 Newbury Rd
- 2198 Newbury Rd
- 2123 Huddersfield Way Unit B
- 2123 Huddersfield Way Unit A
- 2123 Huddersfield Way
- 2113 Huddersfield Way
- 2155 Newbury Rd
- 2103 Huddersfield Way Unit 1
- 2179 Newbury Rd Unit 1
- 2185 Newbury Rd
- 2093 Huddersfield Way Unit 1