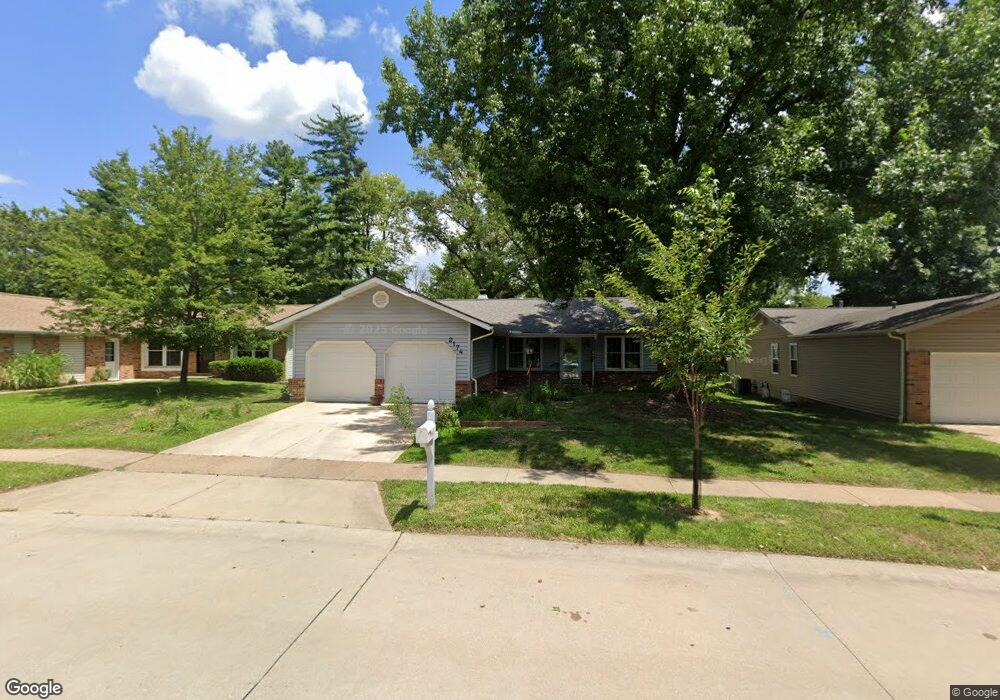
2174 Pheasant Run Dr Maryland Heights, MO 63043
Estimated Value: $357,063 - $398,000
3
Beds
2
Baths
1,610
Sq Ft
$233/Sq Ft
Est. Value
About This Home
This home is located at 2174 Pheasant Run Dr, Maryland Heights, MO 63043 and is currently estimated at $374,766, approximately $232 per square foot. 2174 Pheasant Run Dr is a home located in St. Louis County with nearby schools including McKelvey Elementary School, Parkway Northeast Middle School, and Parkway North High School.
Ownership History
Date
Name
Owned For
Owner Type
Purchase Details
Closed on
Feb 29, 2016
Sold by
Moulton Deborah
Bought by
Moulton Melissa and Margaret E Moulton Living Trust
Current Estimated Value
Home Financials for this Owner
Home Financials are based on the most recent Mortgage that was taken out on this home.
Original Mortgage
$283,500
Outstanding Balance
$278,593
Interest Rate
4.01%
Mortgage Type
Reverse Mortgage Home Equity Conversion Mortgage
Estimated Equity
$96,173
Purchase Details
Closed on
Dec 29, 2006
Sold by
Moulton Margaret E and Moulton Deborah
Bought by
Moulton Margaret E and Margaret E Moulton Living Trust
Purchase Details
Closed on
Nov 17, 2004
Sold by
Strout Alfred B and Strout Kathleen A
Bought by
Moulton Margaret Ellen and Moulton Deborah
Home Financials for this Owner
Home Financials are based on the most recent Mortgage that was taken out on this home.
Original Mortgage
$99,000
Interest Rate
5.37%
Mortgage Type
Purchase Money Mortgage
Create a Home Valuation Report for This Property
The Home Valuation Report is an in-depth analysis detailing your home's value as well as a comparison with similar homes in the area
Home Values in the Area
Average Home Value in this Area
Purchase History
| Date | Buyer | Sale Price | Title Company |
|---|---|---|---|
| Moulton Melissa | -- | National Closing Solutions | |
| Moulton Margaret E | -- | None Available | |
| Moulton Margaret Ellen | $199,900 | -- |
Source: Public Records
Mortgage History
| Date | Status | Borrower | Loan Amount |
|---|---|---|---|
| Open | Moulton Melissa | $283,500 | |
| Closed | Moulton Margaret Ellen | $99,000 |
Source: Public Records
Tax History Compared to Growth
Tax History
| Year | Tax Paid | Tax Assessment Tax Assessment Total Assessment is a certain percentage of the fair market value that is determined by local assessors to be the total taxable value of land and additions on the property. | Land | Improvement |
|---|---|---|---|---|
| 2025 | $3,950 | $59,430 | $14,080 | $45,350 |
| 2024 | $3,950 | $55,340 | $11,720 | $43,620 |
| 2023 | $3,950 | $55,340 | $11,720 | $43,620 |
| 2022 | $3,821 | $49,420 | $11,720 | $37,700 |
| 2021 | $3,858 | $49,420 | $11,720 | $37,700 |
| 2020 | $3,557 | $45,960 | $15,520 | $30,440 |
| 2019 | $3,513 | $45,960 | $15,520 | $30,440 |
| 2018 | $3,028 | $36,430 | $10,170 | $26,260 |
| 2017 | $2,994 | $36,430 | $10,170 | $26,260 |
| 2016 | $2,865 | $33,200 | $7,830 | $25,370 |
| 2015 | $2,991 | $33,200 | $7,830 | $25,370 |
| 2014 | $2,729 | $33,110 | $7,540 | $25,570 |
Source: Public Records
Map
Nearby Homes
- 2234 Arborview Dr
- 12201 Dr
- 2213 Rule Ave
- 2 Aspen II
- 2 Nottingham at Louiselle Park
- 2427 Pheasant Run Dr
- 2041 Falling Brook Dr
- 2 Hermitage II at Louiselle Park
- 2 Ashford at Louiselle Park
- 2 Sterling at Louiselle Park
- 12241 Rain Hollow Dr
- 2229 Murray Forest Dr
- 2 Sequoia at Louiselle Park
- 2444 Pheasant Run Dr
- 2 Royal II at Louiselle Park
- 2244 Canyonlands Dr Unit B
- 2244 Canyonlands Dr Unit E
- 2 Pin Oak at Louiselle Park
- 2 Hickory at Louiselle Park
- 11932 Ameling Rd
- 2170 Pheasant Run Dr
- 2182 Pheasant Run Dr
- 2166 Pheasant Run Dr
- 2189 Cherrycove Ct
- 2185 Cherrycove Ct
- 2193 Cherrycove Ct
- 2192 Pheasant Run Dr
- 2160 Pheasant Run Dr
- 2181 Cherrycove Ct
- 2197 Cherrycove Ct
- 2177 Cherrycove Ct
- 2156 Pheasant Run Dr
- 2173 Cherrycove Ct
- 2152 Pheasant Run Dr
- 2186 Cherrycove Ct
- 12117 Sage Glen Ct
- 2198 Cherrycove Ct
- 2176 Cherrycove Ct
- 2302 Pheasant Run Dr
- 2169 Cherrycove Ct