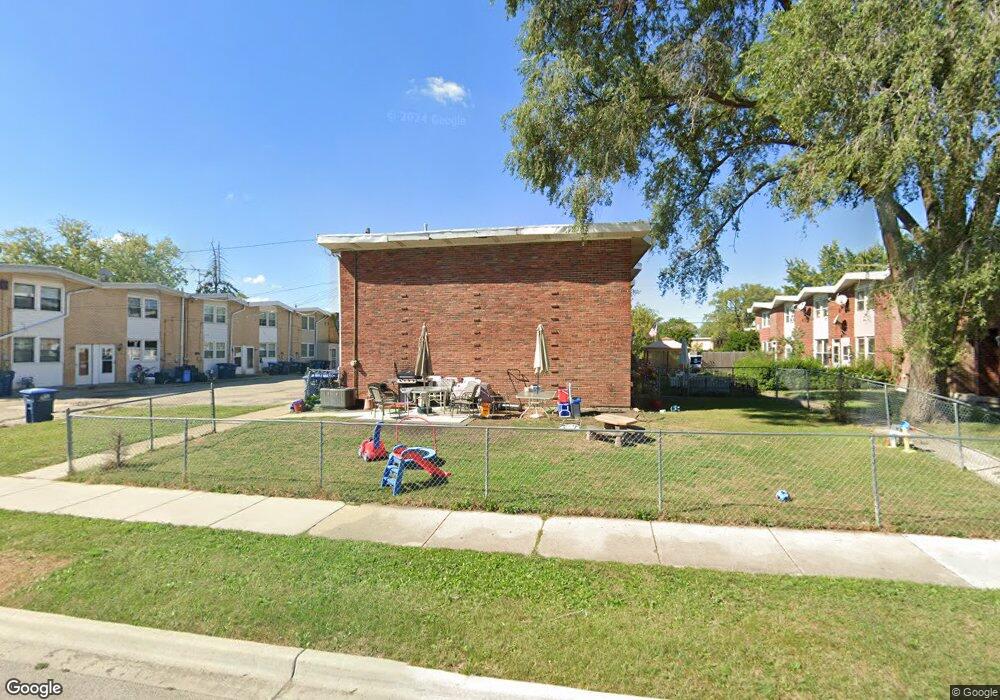
2174 S Chestnut St Des Plaines, IL 60018
Estimated Value: $246,000 - $258,070
3
Beds
2
Baths
1,152
Sq Ft
$218/Sq Ft
Est. Value
About This Home
This home is located at 2174 S Chestnut St, Des Plaines, IL 60018 and is currently estimated at $251,268, approximately $218 per square foot. 2174 S Chestnut St is a home located in Cook County with nearby schools including Plainfield Elementary School, Algonquin Middle School, and Maine West High School.
Ownership History
Date
Name
Owned For
Owner Type
Purchase Details
Closed on
Nov 28, 2007
Sold by
Jacob Thomas and Jacob Suja
Bought by
Thomas Jacob and Thomas Jacob Suja
Current Estimated Value
Purchase Details
Closed on
Jan 24, 2006
Sold by
Sanchez Humberto and Mora Ana L
Bought by
Jacob Thomas
Home Financials for this Owner
Home Financials are based on the most recent Mortgage that was taken out on this home.
Original Mortgage
$180,900
Outstanding Balance
$117,754
Interest Rate
8.99%
Mortgage Type
Fannie Mae Freddie Mac
Estimated Equity
$133,514
Purchase Details
Closed on
Jan 30, 2003
Sold by
Nava Carmen and Nava Lus Maria
Bought by
Sanchez Humberto and Mora Ana L
Home Financials for this Owner
Home Financials are based on the most recent Mortgage that was taken out on this home.
Original Mortgage
$163,435
Interest Rate
6.06%
Mortgage Type
FHA
Purchase Details
Closed on
Jun 8, 2001
Sold by
Nava Carmen
Bought by
Nava Carmen and Nava Luz Maria
Home Financials for this Owner
Home Financials are based on the most recent Mortgage that was taken out on this home.
Original Mortgage
$93,000
Interest Rate
7.16%
Create a Home Valuation Report for This Property
The Home Valuation Report is an in-depth analysis detailing your home's value as well as a comparison with similar homes in the area
Home Values in the Area
Average Home Value in this Area
Purchase History
| Date | Buyer | Sale Price | Title Company |
|---|---|---|---|
| Thomas Jacob | -- | Cti | |
| Jacob Thomas | $201,000 | Attorneys Title Guaranty Fun | |
| Sanchez Humberto | $166,000 | Burnet Title Llc | |
| Nava Carmen | -- | -- |
Source: Public Records
Mortgage History
| Date | Status | Borrower | Loan Amount |
|---|---|---|---|
| Open | Jacob Thomas | $180,900 | |
| Previous Owner | Sanchez Humberto | $163,435 | |
| Previous Owner | Nava Carmen | $93,000 |
Source: Public Records
Tax History Compared to Growth
Tax History
| Year | Tax Paid | Tax Assessment Tax Assessment Total Assessment is a certain percentage of the fair market value that is determined by local assessors to be the total taxable value of land and additions on the property. | Land | Improvement |
|---|---|---|---|---|
| 2024 | $1,771 | $19,000 | $3,000 | $16,000 |
| 2023 | $1,784 | $19,000 | $3,000 | $16,000 |
| 2022 | $1,784 | $19,000 | $3,000 | $16,000 |
| 2021 | $2,007 | $13,191 | $2,063 | $11,128 |
| 2020 | $2,299 | $13,191 | $2,063 | $11,128 |
| 2019 | $2,328 | $14,822 | $2,063 | $12,759 |
| 2018 | $2,082 | $13,146 | $1,821 | $11,325 |
| 2017 | $2,870 | $13,146 | $1,821 | $11,325 |
| 2016 | $2,959 | $13,146 | $1,821 | $11,325 |
| 2015 | $3,150 | $13,043 | $1,578 | $11,465 |
| 2014 | $3,100 | $13,043 | $1,578 | $11,465 |
| 2013 | $3,005 | $13,043 | $1,578 | $11,465 |
Source: Public Records
Map
Nearby Homes
- 2131 Ash St Unit G
- 2061 Pine St Unit C
- 2017 Pine St Unit B
- 2055 Lee St
- 1857 Pine St
- 1629 E Touhy Ave
- 1641 E Touhy Ave
- 1624 Estes Ave
- 1783 Lee St
- 1847 Dexter Ln
- 1776 Stockton Ave
- 2025 Plainfield Dr
- 1765 Prospect Ave
- 1895 Welwyn Ave
- 1668 S Cora St
- 2054 Birch St
- 1721 Linden St
- 2209 Douglas Ave
- 2358 Westview Dr
- 2646 Maple St
- 2174 S Chestnut St Unit E
- 2174 S Chestnut St Unit B
- 2174 S Chestnut St
- 2174 S Chestnut St
- 2174 S Chestnut St
- 2174 S Chestnut St
- 2174 S Chestnut St
- 1384 Fargo Ave
- 1382 Fargo Ave
- 1380 Fargo Ave
- 2172 S Chestnut St
- 2172 S Chestnut St
- 2172 S Chestnut St
- 2172 S Chestnut St
- 2172 S Chestnut St
- 2172 S Chestnut St
- 2172 S Chestnut St Unit A
- 2172 S Chestnut St Unit F
- 1386 Fargo Ave
- 1388 Fargo Ave