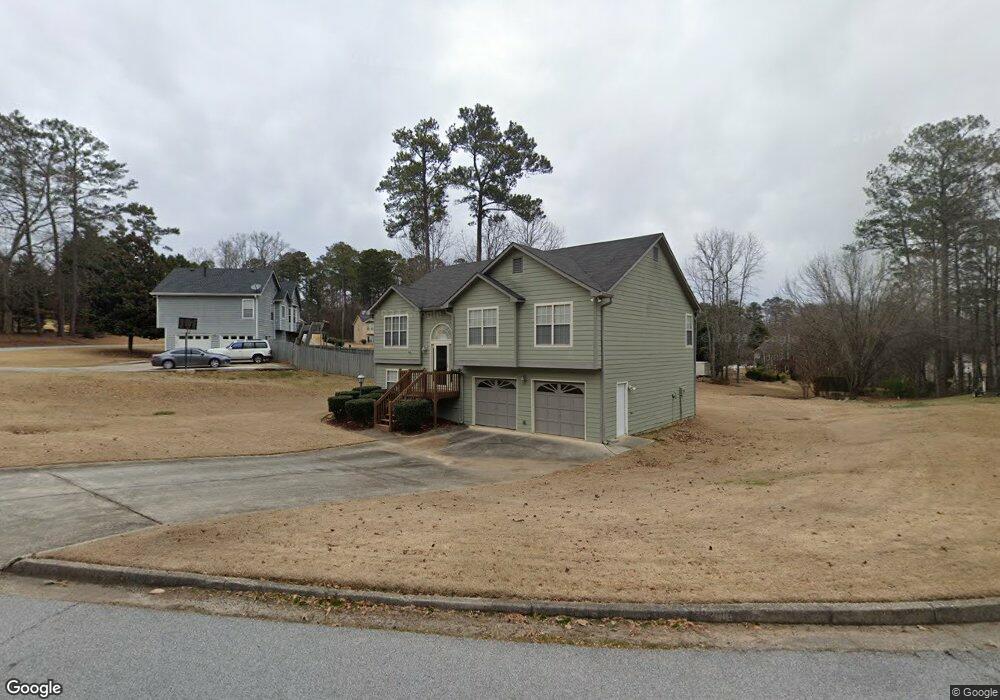
2175 Alyssa Ct Lithia Springs, GA 30122
Lithia Springs NeighborhoodEstimated Value: $249,000 - $328,000
3
Beds
2
Baths
1,475
Sq Ft
$193/Sq Ft
Est. Value
About This Home
This home is located at 2175 Alyssa Ct, Lithia Springs, GA 30122 and is currently estimated at $284,271, approximately $192 per square foot. 2175 Alyssa Ct is a home located in Douglas County with nearby schools including Sweetwater Elementary School, Factory Shoals Middle School, and Lithia Springs Comprehensive High School.
Ownership History
Date
Name
Owned For
Owner Type
Purchase Details
Closed on
Dec 28, 1998
Sold by
Walpola Rajtha J and Walpola Ruvin
Bought by
Folks Michael and Folks Patricia
Current Estimated Value
Home Financials for this Owner
Home Financials are based on the most recent Mortgage that was taken out on this home.
Original Mortgage
$206,387
Outstanding Balance
$57,240
Interest Rate
6.85%
Mortgage Type
New Conventional
Estimated Equity
$227,031
Purchase Details
Closed on
Aug 27, 1997
Sold by
Blankenship Homes Inc
Bought by
Foote Susan E and Foote Joyce E
Home Financials for this Owner
Home Financials are based on the most recent Mortgage that was taken out on this home.
Original Mortgage
$100,600
Interest Rate
7.39%
Mortgage Type
FHA
Create a Home Valuation Report for This Property
The Home Valuation Report is an in-depth analysis detailing your home's value as well as a comparison with similar homes in the area
Home Values in the Area
Average Home Value in this Area
Purchase History
| Date | Buyer | Sale Price | Title Company |
|---|---|---|---|
| Folks Michael | $217,300 | -- | |
| Foote Susan E | $102,400 | -- |
Source: Public Records
Mortgage History
| Date | Status | Borrower | Loan Amount |
|---|---|---|---|
| Open | Folks Michael | $206,387 | |
| Previous Owner | Foote Susan E | $100,600 |
Source: Public Records
Tax History Compared to Growth
Tax History
| Year | Tax Paid | Tax Assessment Tax Assessment Total Assessment is a certain percentage of the fair market value that is determined by local assessors to be the total taxable value of land and additions on the property. | Land | Improvement |
|---|---|---|---|---|
| 2024 | $2,136 | $79,680 | $10,600 | $69,080 |
| 2023 | $2,136 | $79,680 | $10,600 | $69,080 |
| 2022 | $2,206 | $79,680 | $10,600 | $69,080 |
| 2021 | $1,941 | $66,240 | $10,680 | $55,560 |
| 2020 | $1,639 | $66,240 | $10,680 | $55,560 |
| 2019 | $1,837 | $64,760 | $10,680 | $54,080 |
| 2018 | $1,801 | $62,560 | $10,680 | $51,880 |
| 2017 | $1,700 | $56,360 | $10,680 | $45,680 |
| 2016 | $1,556 | $49,800 | $9,720 | $40,080 |
| 2015 | $1,320 | $41,720 | $8,480 | $33,240 |
| 2014 | $1,582 | $48,760 | $10,600 | $38,160 |
| 2013 | -- | $48,760 | $10,600 | $38,160 |
Source: Public Records
Map
Nearby Homes
- 2756 Montie Ct
- LOT 27 Chestnut Ln
- 3924 Fairhaven Rd
- 3636 Meadowview Dr
- HAYDEN Plan at Fairhaven
- GREEN Plan at Fairhaven
- CALI Plan at Fairhaven
- ELLE Plan at Fairhaven
- PENWELL Plan at Fairhaven
- 3948 Fairhaven Rd
- 3964 Fairhaven Rd
- 8684 Hickory Ln
- 2741 Montie Ct
- 3940 Fairhaven Rd
- 3552 Meadowview Dr
- 2740 Montie Ct
- 3790 Sweetbriar Cir
- 3957 Fairhaven Rd
- 3646 Briar Dr
- 8767 N View Dr
- 2205 Alyssa Ct Unit 2
- 2213 Alyssa Ct Unit 2
- 2161 Alyssa Ct Unit 2
- 2221 Alyssa Ct
- 2178 Alyssa Ct
- 2170 Alyssa Ct Unit 2
- 2162 Alyssa Ct
- 2158 Alyssa Ct
- 2188 Alyssa Ct Unit 2
- 2227 Alyssa Ct Unit 2
- 2202 Alyssa Ct
- 2196 Alyssa Ct
- 2627 Johnsbrooke Dr
- 2210 Alyssa Ct Unit 2
- 2621 Johnsbrooke Dr Unit 1
- 2633 Johnsbrooke Dr
- 2275 Alyssa Ct Unit 2
- 2281 Alyssa Ct Unit 2
- 2271 Alyssa Ct Unit 2
- 2218 Alyssa Ct