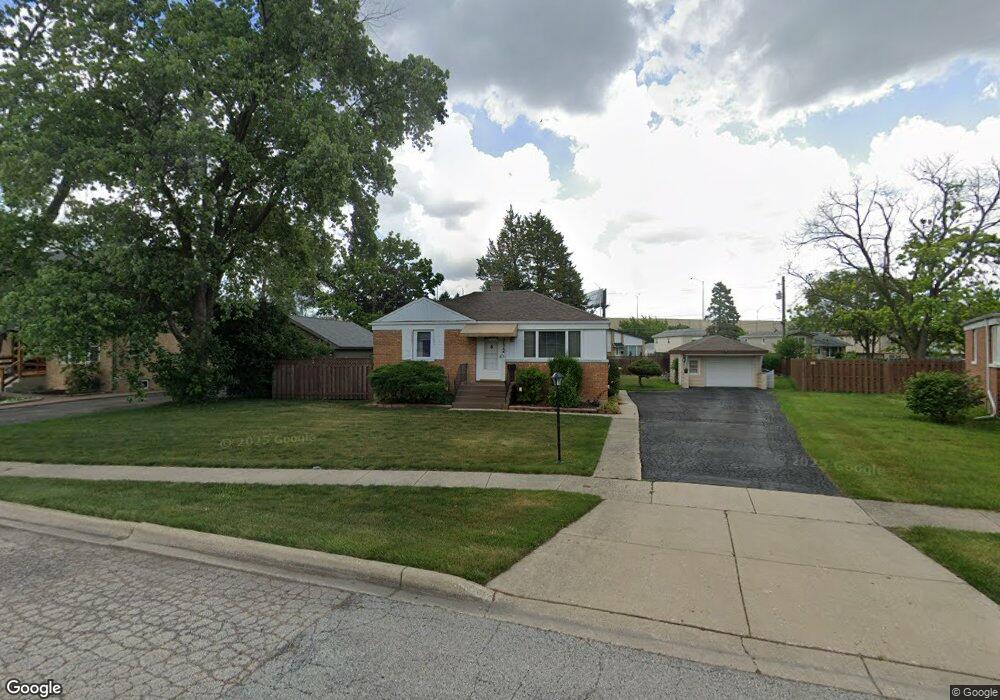
2175 Laura Ln Des Plaines, IL 60018
Estimated Value: $301,000 - $360,000
2
Beds
1
Bath
792
Sq Ft
$419/Sq Ft
Est. Value
About This Home
This home is located at 2175 Laura Ln, Des Plaines, IL 60018 and is currently estimated at $332,140, approximately $419 per square foot. 2175 Laura Ln is a home located in Cook County with nearby schools including Orchard Place Elementary School, Algonquin Middle School, and Maine West High School.
Ownership History
Date
Name
Owned For
Owner Type
Purchase Details
Closed on
Mar 28, 2011
Sold by
Federal Home Loan Mtg Corp
Bought by
Krzeminski George
Current Estimated Value
Home Financials for this Owner
Home Financials are based on the most recent Mortgage that was taken out on this home.
Original Mortgage
$104,193
Outstanding Balance
$71,912
Interest Rate
5.04%
Mortgage Type
New Conventional
Estimated Equity
$260,228
Purchase Details
Closed on
Jan 29, 2010
Sold by
Zurek
Bought by
Federal Home Loan Mortgage Corp
Purchase Details
Closed on
Dec 12, 2006
Sold by
Lotz Virginia A
Bought by
Zurek Beata
Home Financials for this Owner
Home Financials are based on the most recent Mortgage that was taken out on this home.
Original Mortgage
$215,200
Interest Rate
7.62%
Mortgage Type
Unknown
Purchase Details
Closed on
Jul 28, 2003
Sold by
Lotz Virginia A
Bought by
Lotz Virginia A and The Virginia A Lotz Trust
Create a Home Valuation Report for This Property
The Home Valuation Report is an in-depth analysis detailing your home's value as well as a comparison with similar homes in the area
Home Values in the Area
Average Home Value in this Area
Purchase History
| Date | Buyer | Sale Price | Title Company |
|---|---|---|---|
| Krzeminski George | $102,000 | -- | |
| Krzeminski George | $102,000 | -- | |
| Krzeminski George | $102,000 | -- | |
| Federal Home Loan Mortgage Corp | -- | None Available | |
| Zurek Beata | $269,000 | Git | |
| Lotz Virginia A | -- | -- |
Source: Public Records
Mortgage History
| Date | Status | Borrower | Loan Amount |
|---|---|---|---|
| Open | Krzeminski George | $104,193 | |
| Closed | Krzeminski George | $104,193 | |
| Previous Owner | Zurek Beata | $215,200 |
Source: Public Records
Tax History Compared to Growth
Tax History
| Year | Tax Paid | Tax Assessment Tax Assessment Total Assessment is a certain percentage of the fair market value that is determined by local assessors to be the total taxable value of land and additions on the property. | Land | Improvement |
|---|---|---|---|---|
| 2024 | $4,337 | $23,080 | $9,014 | $14,066 |
| 2023 | $5,106 | $26,000 | $9,014 | $16,986 |
| 2022 | $5,106 | $26,000 | $9,014 | $16,986 |
| 2021 | $3,443 | $17,194 | $7,511 | $9,683 |
| 2020 | $3,508 | $17,194 | $7,511 | $9,683 |
| 2019 | $4,276 | $19,320 | $7,511 | $11,809 |
| 2018 | $3,844 | $16,288 | $6,610 | $9,678 |
| 2017 | $3,793 | $16,288 | $6,610 | $9,678 |
| 2016 | $3,832 | $16,288 | $6,610 | $9,678 |
| 2015 | $4,475 | $17,427 | $5,709 | $11,718 |
| 2014 | $4,397 | $17,427 | $5,709 | $11,718 |
| 2013 | $4,270 | $17,427 | $5,709 | $11,718 |
Source: Public Records
Map
Nearby Homes
- 38 E Touhy Ave
- 2126 David Dr
- 2600 S Scott St
- 1966 Laura Ln
- 2609 Eisenhower Dr
- 2500 Maple St
- 2646 Maple St
- 1706 Buckingham Dr
- 200 Thames Pkwy Unit 1
- 1757 Farwell Ave
- 44 Park Ln Unit 435
- 22 Park Ln Unit 203
- 201 Thames Pkwy Unit 2F
- 500 Thames Pkwy Unit 1F
- 1641 E Touhy Ave
- 1629 E Touhy Ave
- 400 Ascot Dr Unit 3M
- 2993 Curtis St Unit C41
- 2400 Archbury Ln Unit 2
- 3051 S Scott St
- 2171 Laura Ln
- 2181 Laura Ln
- 2555 Rusty Dr
- 2535 Parkwood Ln
- 2527 Parkwood Ln
- 2543 Parkwood Ln
- 2183 Laura Ln
- 2519 Parkwood Ln
- 2551 Parkwood Ln
- 2581 Rusty Dr Unit 2
- 2535 Rusty Dr
- 2511 Parkwood Ln
- 2559 Parkwood Ln
- 2170 Laura Ln
- 2503 Parkwood Ln
- 2567 Parkwood Ln
- 2515 Rusty Dr
- 2497 Parkwood Ln
- 2575 Parkwood Ln
- 2181 Estes Ave