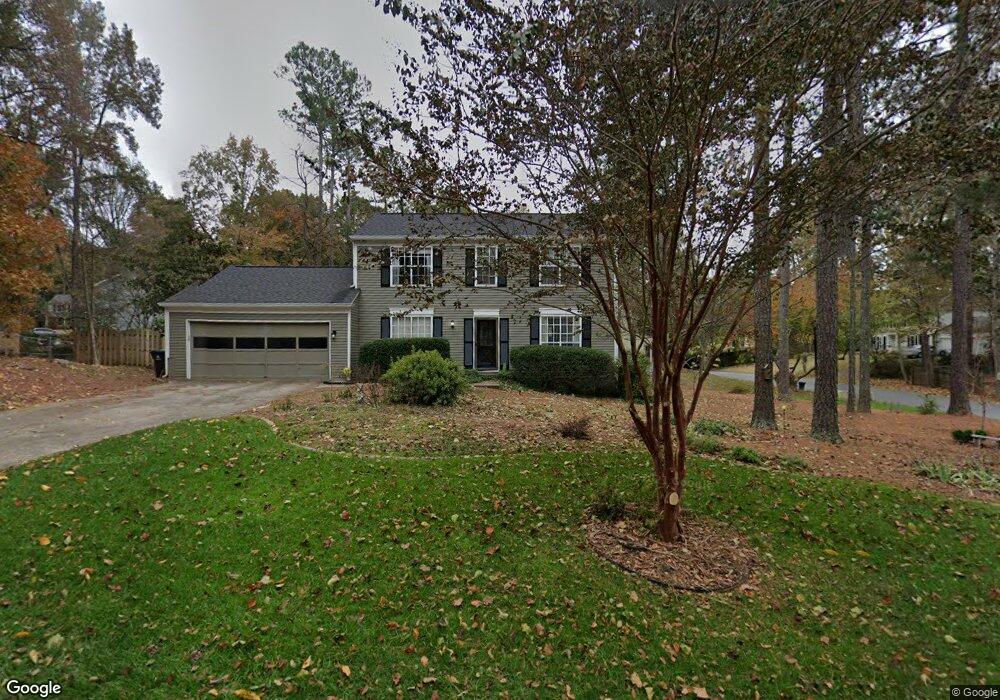
2175 Laurel Mill Way Unit 5 Roswell, GA 30076
Barrington NeighborhoodEstimated Value: $473,000 - $545,000
4
Beds
3
Baths
2,208
Sq Ft
$235/Sq Ft
Est. Value
About This Home
This home is located at 2175 Laurel Mill Way Unit 5, Roswell, GA 30076 and is currently estimated at $518,201, approximately $234 per square foot. 2175 Laurel Mill Way Unit 5 is a home located in Fulton County with nearby schools including Northwood Elementary School, Haynes Bridge Middle School, and Centennial High School.
Ownership History
Date
Name
Owned For
Owner Type
Purchase Details
Closed on
Jun 2, 2006
Sold by
Pritchard Jason E and Pritchard Jessica M
Bought by
Hightower Joyce E
Current Estimated Value
Home Financials for this Owner
Home Financials are based on the most recent Mortgage that was taken out on this home.
Original Mortgage
$169,600
Outstanding Balance
$99,320
Interest Rate
6.5%
Mortgage Type
New Conventional
Estimated Equity
$418,881
Purchase Details
Closed on
Oct 31, 2001
Sold by
Herring John F
Bought by
Herring John F and Herring Keri H
Home Financials for this Owner
Home Financials are based on the most recent Mortgage that was taken out on this home.
Original Mortgage
$138,500
Interest Rate
6.67%
Mortgage Type
New Conventional
Purchase Details
Closed on
Sep 24, 1999
Sold by
Robinson John E and Robinson Zellee S
Bought by
Herring John F
Home Financials for this Owner
Home Financials are based on the most recent Mortgage that was taken out on this home.
Original Mortgage
$134,472
Interest Rate
7.85%
Mortgage Type
New Conventional
Create a Home Valuation Report for This Property
The Home Valuation Report is an in-depth analysis detailing your home's value as well as a comparison with similar homes in the area
Home Values in the Area
Average Home Value in this Area
Purchase History
| Date | Buyer | Sale Price | Title Company |
|---|---|---|---|
| Hightower Joyce E | $212,000 | -- | |
| Herring John F | -- | -- | |
| Herring John F | $141,600 | -- |
Source: Public Records
Mortgage History
| Date | Status | Borrower | Loan Amount |
|---|---|---|---|
| Open | Hightower Joyce E | $169,600 | |
| Previous Owner | Herring John F | $138,500 | |
| Previous Owner | Herring John F | $134,472 |
Source: Public Records
Tax History Compared to Growth
Tax History
| Year | Tax Paid | Tax Assessment Tax Assessment Total Assessment is a certain percentage of the fair market value that is determined by local assessors to be the total taxable value of land and additions on the property. | Land | Improvement |
|---|---|---|---|---|
| 2025 | $645 | $181,360 | $37,000 | $144,360 |
| 2023 | $5,094 | $180,480 | $37,680 | $142,800 |
| 2022 | $1,868 | $135,640 | $23,840 | $111,800 |
| 2021 | $2,225 | $114,240 | $27,160 | $87,080 |
| 2020 | $2,256 | $107,720 | $25,440 | $82,280 |
| 2019 | $382 | $105,800 | $24,960 | $80,840 |
| 2018 | $2,217 | $97,400 | $18,640 | $78,760 |
| 2017 | $1,769 | $72,560 | $11,800 | $60,760 |
| 2016 | $1,767 | $72,560 | $11,800 | $60,760 |
| 2015 | $2,170 | $72,560 | $11,800 | $60,760 |
| 2014 | $1,834 | $72,560 | $11,800 | $60,760 |
Source: Public Records
Map
Nearby Homes
- 295 Crab Orchard Way
- 780 Crab Orchard Dr
- 500 Barrington Dr W
- 105 Laurel Mill Ct
- 485 Sheringham Ct
- 435 Sheringham Terrace
- 590 Sheringham Ct
- 500 Cranberry Place Unit 6
- 680 Barrington Way
- 600 Jardin Ct Unit 48
- 2020 Jardin Ct Unit 1
- 515 Forest Place
- 650 Lake Forest Ct
- 620 Lake Forest Ct
- 1095 Northpointe Trace
- 9985 Lake Forest Way
- 105 May Glen Way
- 135 Laurel Mill Terrace
- 2185 Laurel Mill Way
- 2170 Laurel Mill Way
- 0 Laurel Mill Terrace Unit 7029191
- 115 Big Creek Ct Unit 5
- 125 Laurel Mill Terrace Unit 5
- 2150 Laurel Mill Way Unit 5
- 2145 Laurel Mill Way
- 2180 Laurel Mill Way
- 2140 Laurel Mill Way
- 125 Big Creek Ct Unit 5
- 130 Laurel Mill Terrace
- 0 Laurel Mill Way Unit 8709631
- 0 Laurel Mill Way Unit 8485553
- 0 Laurel Mill Way Unit 8688451
- 0 Laurel Mill Way Unit 7073087
- 0 Laurel Mill Way Unit 8619276
- 0 Laurel Mill Way Unit 8307922
- 0 Laurel Mill Way Unit 8102457
- 0 Laurel Mill Way Unit 7379150