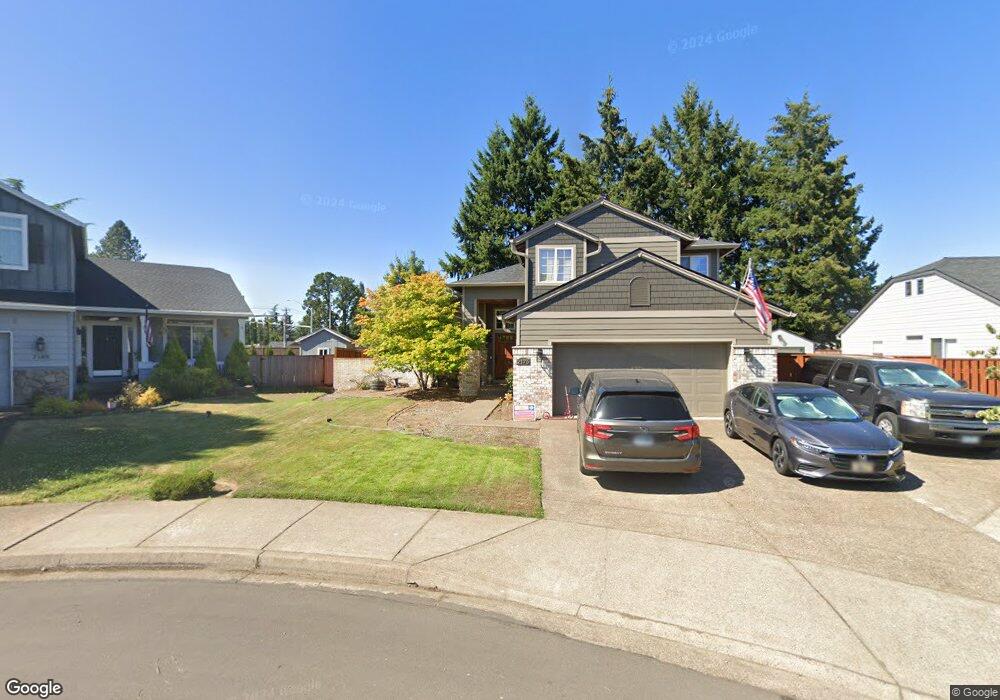
2176 NE Sundown Ct Hillsboro, OR 97124
Northwest Hillsboro NeighborhoodEstimated Value: $551,000 - $593,000
4
Beds
3
Baths
1,879
Sq Ft
$304/Sq Ft
Est. Value
About This Home
This home is located at 2176 NE Sundown Ct, Hillsboro, OR 97124 and is currently estimated at $571,454, approximately $304 per square foot. 2176 NE Sundown Ct is a home located in Washington County with nearby schools including Paul L. Patterson Elementary School, Evergreen Jr High School, and Glencoe High School.
Ownership History
Date
Name
Owned For
Owner Type
Purchase Details
Closed on
Feb 29, 2016
Sold by
Moody Christine M
Bought by
Buchanan Thomas J and Buchanan Juli A
Current Estimated Value
Home Financials for this Owner
Home Financials are based on the most recent Mortgage that was taken out on this home.
Original Mortgage
$331,455
Outstanding Balance
$263,732
Interest Rate
3.81%
Mortgage Type
New Conventional
Estimated Equity
$307,722
Purchase Details
Closed on
Jun 2, 2005
Sold by
Wagner Julie Ann and Wagner Jon Kent
Bought by
Moody James M and Moody Christine M
Home Financials for this Owner
Home Financials are based on the most recent Mortgage that was taken out on this home.
Original Mortgage
$256,000
Interest Rate
5.74%
Mortgage Type
VA
Purchase Details
Closed on
Jun 13, 2001
Sold by
Burlingame William E and Burlingame Judy E
Bought by
Wagner Julie Ann and Wagner Jon Kent
Home Financials for this Owner
Home Financials are based on the most recent Mortgage that was taken out on this home.
Original Mortgage
$197,880
Interest Rate
7.14%
Create a Home Valuation Report for This Property
The Home Valuation Report is an in-depth analysis detailing your home's value as well as a comparison with similar homes in the area
Home Values in the Area
Average Home Value in this Area
Purchase History
| Date | Buyer | Sale Price | Title Company |
|---|---|---|---|
| Buchanan Thomas J | $348,900 | Wfg Title | |
| Moody James M | $281,000 | Ticor Title Insurance Compan | |
| Wagner Julie Ann | $204,000 | Ticor Title |
Source: Public Records
Mortgage History
| Date | Status | Borrower | Loan Amount |
|---|---|---|---|
| Open | Buchanan Thomas J | $331,455 | |
| Previous Owner | Moody James M | $256,000 | |
| Previous Owner | Wagner Julie Ann | $197,880 |
Source: Public Records
Tax History Compared to Growth
Tax History
| Year | Tax Paid | Tax Assessment Tax Assessment Total Assessment is a certain percentage of the fair market value that is determined by local assessors to be the total taxable value of land and additions on the property. | Land | Improvement |
|---|---|---|---|---|
| 2025 | $5,229 | $319,880 | -- | -- |
| 2024 | $5,080 | $310,570 | -- | -- |
| 2023 | $5,080 | $301,530 | $0 | $0 |
| 2022 | $4,942 | $301,530 | $0 | $0 |
| 2021 | $4,843 | $284,230 | $0 | $0 |
| 2020 | $4,739 | $275,960 | $0 | $0 |
| 2019 | $4,603 | $267,930 | $0 | $0 |
| 2018 | $4,406 | $260,130 | $0 | $0 |
| 2017 | $4,246 | $252,560 | $0 | $0 |
| 2016 | $4,130 | $245,210 | $0 | $0 |
| 2015 | $3,963 | $238,070 | $0 | $0 |
| 2014 | $3,941 | $231,140 | $0 | $0 |
Source: Public Records
Map
Nearby Homes
- 175 NE Chancellor Ct
- 1775 NE Carole Ct
- 1676 NE 2nd Ave
- 1756 NW 9th Ave
- 555 NW Hertel St
- 1560 NW 6th Ave
- 528 NW Celtis Ln
- 2643 NE 2nd Dr
- 807 NW Brookhill St
- 923 NW Brookhill St
- 660 NW Ledum Ln
- 2011 NE Josephine Dr
- 3166 NE Glencoe Oaks Place
- 635 NW Queens Ct
- 2973 NE Aurora Dr
- 2878 NE Aurora Dr
- 1425 NE Glen Ellen Dr
- 3968 NW 3rd Ave
- 1 NE 3rd Ave
- 31385 NW Milne St
- 2164 NE Sundown Ct
- 2188 NE Sundown Ct
- 2196 NE Sundown Ct
- 2150 NE Sundown Ct
- 2103 NE Sundown Ct
- 2193 NE Sundown Ct
- 2765 NW Glencoe Rd-Dev
- 2765 NW Glencoe Rd -Develop
- 2173 NE Sundown Ct
- 2138 NE Sundown Ct
- 2185 NE Sundown Ct
- 2099 NE Sundown Ct
- 2675 NW Glencoe Rd
- 2735 NW Glencoe Rd
- 103 NW Glencory St
- 2126 NE Sundown Ct
- 2146 NW 2nd Ave
- 2138 NW 2nd Ave
- 2114 NE Sundown Ct
- 2130 NW 2nd Ave