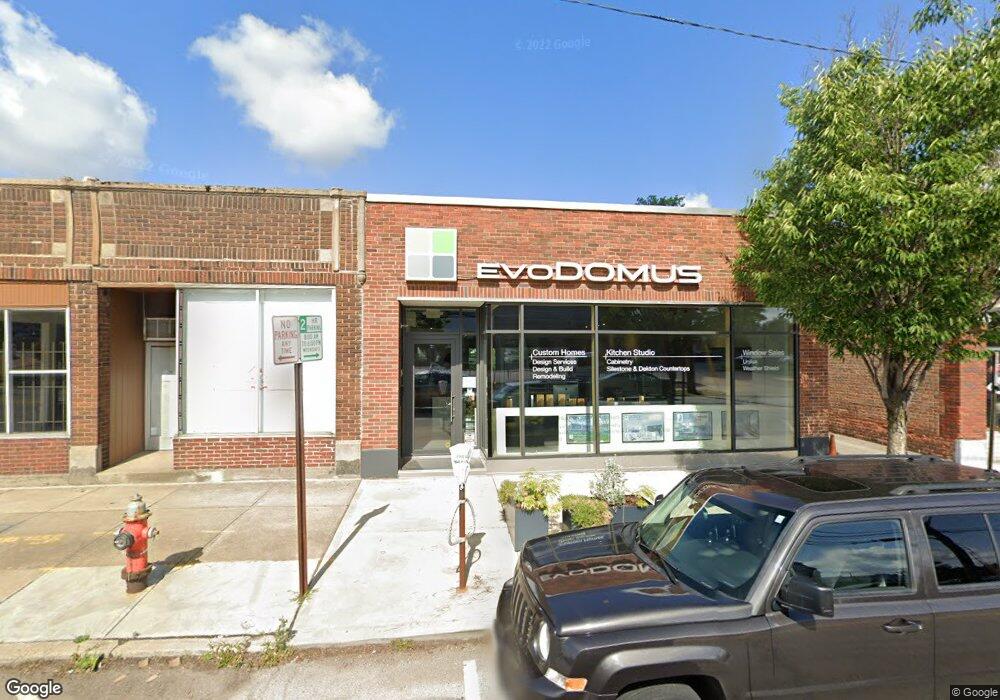
2176 S Taylor Rd Cleveland Heights, OH 44118
--
Bed
--
Bath
3,600
Sq Ft
5,663
Sq Ft Lot
About This Home
This home is located at 2176 S Taylor Rd, Cleveland Heights, OH 44118. 2176 S Taylor Rd is a home located in Cuyahoga County with nearby schools including Fairfax Elementary School, Roxboro Middle School, and Cleveland Heights High School.
Ownership History
Date
Name
Owned For
Owner Type
Purchase Details
Closed on
Jul 19, 2021
Sold by
K And K One Holding Llc
Bought by
Domus Immobili Llc
Home Financials for this Owner
Home Financials are based on the most recent Mortgage that was taken out on this home.
Original Mortgage
$247,033
Outstanding Balance
$224,144
Interest Rate
2.9%
Mortgage Type
Future Advance Clause Open End Mortgage
Purchase Details
Closed on
Jan 6, 2017
Sold by
Desatnik Martin
Bought by
K And K One Holding Llc
Home Financials for this Owner
Home Financials are based on the most recent Mortgage that was taken out on this home.
Original Mortgage
$152,000
Interest Rate
4.03%
Mortgage Type
Commercial
Purchase Details
Closed on
Nov 29, 2006
Sold by
Desatnik Abe and Desatnik Ann
Bought by
Desatnik Martin
Purchase Details
Closed on
Jul 25, 1979
Bought by
Desatnik Abe
Purchase Details
Closed on
Oct 31, 1975
Sold by
Kass Samuel L
Bought by
Mazel Co
Purchase Details
Closed on
Jan 1, 1975
Bought by
Kass Samuel L
Create a Home Valuation Report for This Property
The Home Valuation Report is an in-depth analysis detailing your home's value as well as a comparison with similar homes in the area
Home Values in the Area
Average Home Value in this Area
Purchase History
| Date | Buyer | Sale Price | Title Company |
|---|---|---|---|
| Domus Immobili Llc | -- | None Available | |
| K And K One Holding Llc | $84,500 | Chicago Title | |
| Desatnik Martin | -- | None Available | |
| Desatnik Abe | $59,200 | -- | |
| Mazel Co | $27,000 | -- | |
| Kass Samuel L | -- | -- |
Source: Public Records
Mortgage History
| Date | Status | Borrower | Loan Amount |
|---|---|---|---|
| Open | Domus Immobili Llc | $247,033 | |
| Previous Owner | K And K One Holding Llc | $152,000 |
Source: Public Records
Tax History Compared to Growth
Tax History
| Year | Tax Paid | Tax Assessment Tax Assessment Total Assessment is a certain percentage of the fair market value that is determined by local assessors to be the total taxable value of land and additions on the property. | Land | Improvement |
|---|---|---|---|---|
| 2024 | $5,062 | $37,135 | $10,080 | $27,055 |
| 2023 | $5,656 | $39,130 | $10,080 | $29,050 |
| 2022 | $5,651 | $39,130 | $10,080 | $29,050 |
| 2021 | $5,586 | $39,130 | $10,080 | $29,050 |
| 2020 | $5,959 | $39,130 | $10,080 | $29,050 |
| 2019 | $5,666 | $111,800 | $28,800 | $83,000 |
| 2018 | $5,652 | $39,130 | $10,080 | $29,050 |
| 2017 | $4,526 | $29,540 | $12,460 | $17,080 |
| 2016 | $4,450 | $29,540 | $12,460 | $17,080 |
| 2015 | $9,502 | $29,540 | $12,460 | $17,080 |
| 2014 | $13,183 | $28,670 | $12,110 | $16,560 |
Source: Public Records
Map
Nearby Homes
- 3395 Tullamore Rd
- 2119 Rossmoor Rd
- 3383 Tullamore Rd
- 3494 Raymont Blvd
- 2272 S Taylor Rd
- 3366 Tullamore Rd
- 3485 Silsby Rd
- 3331 Cedarbrook Rd
- 3525 Raymont Blvd
- 2108 Marlindale Rd
- 2087 Wynn Rd Unit 1
- 2127 Goodnor Rd
- 2085 Wynn Rd Unit 2
- 3368 Silsby Rd
- 2083 Wynn Rd Unit 3
- 3554 Raymont Blvd
- 3365 Meadowbrook Blvd
- 3300 Kildare Rd
- 3288 Kildare Rd
- 3302 Tullamore Rd
- 2184 S Taylor Rd Unit 1
- 3425 Kildare Rd
- 3421 Kildare Rd
- 2186 S Taylor Rd
- 3417 Kildare Rd
- 3428 Kildare Rd
- 3424 Kildare Rd
- 2190 S Taylor Rd
- 3413 Kildare Rd
- 3420 Kildare Rd
- 13450 Cedar Rd Unit 10
- 3416 Kildare Rd
- 2200 S Taylor Rd
- 3409 Kildare Rd
- 3412 Kildare Rd
- 3405 Kildare Rd
- 3408 Kildare Rd
- 3421 Cedarbrook Rd
- 3417 Cedarbrook Rd
- 3409 Cedarbrook Rd