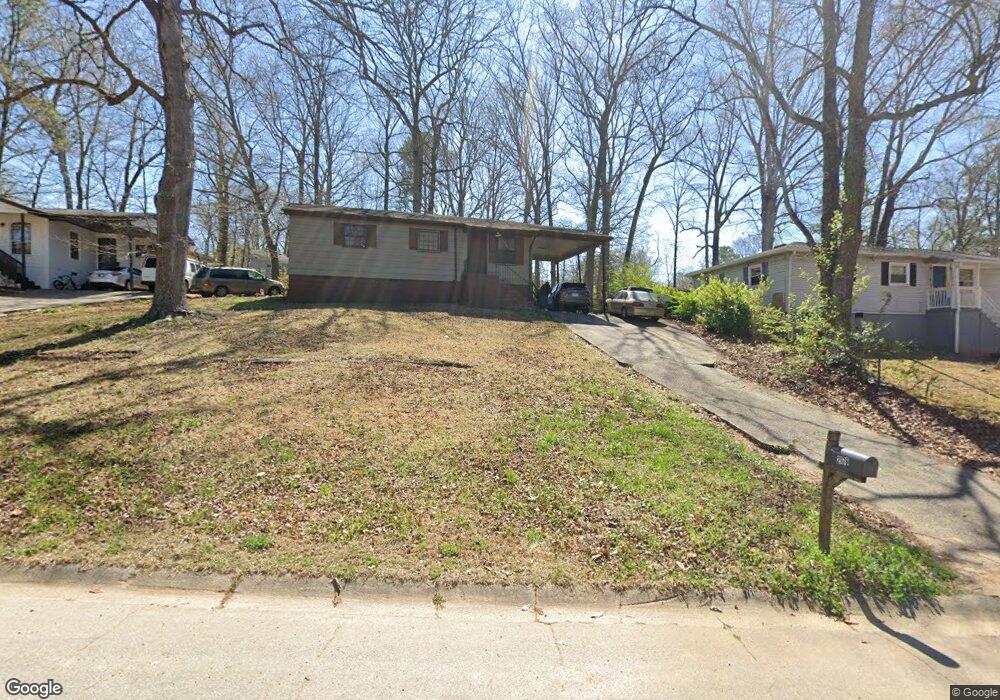
2176 Venesa Cir Austell, GA 30168
Estimated Value: $200,000 - $227,000
3
Beds
1
Bath
912
Sq Ft
$235/Sq Ft
Est. Value
About This Home
This home is located at 2176 Venesa Cir, Austell, GA 30168 and is currently estimated at $214,300, approximately $234 per square foot. 2176 Venesa Cir is a home located in Cobb County with nearby schools including Deerwood Elementary School, Mableton Elementary School, and Garrett Middle School.
Ownership History
Date
Name
Owned For
Owner Type
Purchase Details
Closed on
Jun 27, 2002
Sold by
Middleton Robin E
Bought by
Noble Frank T
Current Estimated Value
Home Financials for this Owner
Home Financials are based on the most recent Mortgage that was taken out on this home.
Original Mortgage
$81,500
Outstanding Balance
$34,119
Interest Rate
6.67%
Mortgage Type
New Conventional
Estimated Equity
$180,181
Purchase Details
Closed on
Dec 14, 2001
Sold by
Ellison Robin A
Bought by
Middleton Robin E
Home Financials for this Owner
Home Financials are based on the most recent Mortgage that was taken out on this home.
Original Mortgage
$52,521
Interest Rate
6.5%
Mortgage Type
FHA
Purchase Details
Closed on
Nov 18, 1996
Sold by
Dashiell Realty Inc
Bought by
Ellison Robin A
Purchase Details
Closed on
Oct 28, 1993
Sold by
Axco Financial Serv Ga
Bought by
Dashiell Realty Inc
Create a Home Valuation Report for This Property
The Home Valuation Report is an in-depth analysis detailing your home's value as well as a comparison with similar homes in the area
Home Values in the Area
Average Home Value in this Area
Purchase History
| Date | Buyer | Sale Price | Title Company |
|---|---|---|---|
| Noble Frank T | $81,500 | -- | |
| Middleton Robin E | -- | -- | |
| Ellison Robin A | $54,900 | -- | |
| Dashiell Realty Inc | $20,000 | -- |
Source: Public Records
Mortgage History
| Date | Status | Borrower | Loan Amount |
|---|---|---|---|
| Open | Noble Frank T | $81,500 | |
| Previous Owner | Middleton Robin E | $52,521 | |
| Closed | Dashiell Realty Inc | -- | |
| Closed | Dashiell Realty Inc | $25,315 | |
| Closed | Ellison Robin A | $0 |
Source: Public Records
Tax History Compared to Growth
Tax History
| Year | Tax Paid | Tax Assessment Tax Assessment Total Assessment is a certain percentage of the fair market value that is determined by local assessors to be the total taxable value of land and additions on the property. | Land | Improvement |
|---|---|---|---|---|
| 2025 | $1,545 | $85,624 | $22,000 | $63,624 |
| 2024 | $1,391 | $77,392 | $18,000 | $59,392 |
| 2023 | $783 | $69,860 | $18,000 | $51,860 |
| 2022 | $997 | $55,868 | $12,000 | $43,868 |
| 2021 | $745 | $42,232 | $8,000 | $34,232 |
| 2020 | $470 | $27,784 | $8,000 | $19,784 |
| 2019 | $470 | $27,784 | $8,000 | $19,784 |
| 2018 | $323 | $21,696 | $8,000 | $13,696 |
| 2017 | $176 | $16,784 | $4,800 | $11,984 |
| 2016 | $177 | $16,784 | $4,800 | $11,984 |
| 2015 | $141 | $15,188 | $4,800 | $10,388 |
| 2014 | $67 | $12,376 | $0 | $0 |
Source: Public Records
Map
Nearby Homes
- 2145 Venesa Cir
- 1995 Oak Ct
- 1995 Matt Dr
- 1984 Brenda Dr
- 2335 Ravencliff Dr
- 2335 Ravencliff Dr Unit 91
- 2425 Ravencliff Dr Unit 88
- 2425 Ravencliff Dr
- 2070 Ravencliff Dr
- The Norwood II Plan at Sanders Park
- The Greenbrier II Plan at Sanders Park
- The Ellison II Plan at Sanders Park
- The Buford II Plan at Sanders Park
- The Maddux II Plan at Sanders Park
- The Braselton II Plan at Sanders Park
- 1155 Elowen Dr
- 1055 Elowen Dr
- 2420 Ravencliff Dr
- 2420 Ravencliff Dr Unit 143
- 2430 Ravencliff Dr Unit 144
- 2166 Venesa Cir
- 2186 Venesa Cir
- 0 Venesa Cir Unit 7472783
- 0 Venesa Cir Unit 7431042
- 0 Venesa Cir Unit 7300660
- 0 Venesa Cir Unit 7415602
- 0 Venesa Cir Unit 7221074
- 0 Venesa Cir Unit 8955838
- 0 Venesa Cir
- 2005 Oak Ct
- 2196 Venesa Cir
- 2165 Venesa Cir
- 2046 Matt Dr
- 2036 Matt Dr
- 2006 Oak Ct
- 2146 Venesa Cir
- 2185 Venesa Cir
- 2206 Venesa Cir
- 2155 Venesa Cir
- 2195 Venesa Cir