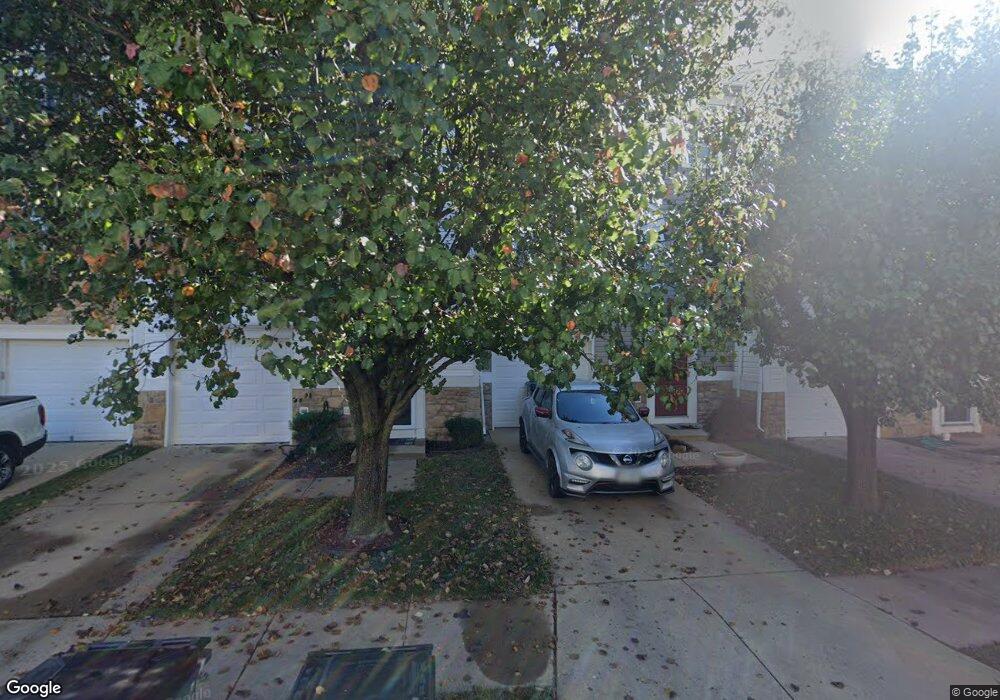
21762 Goose Cross Terrace Ashburn, VA 20147
Estimated Value: $610,115 - $630,000
3
Beds
3
Baths
1,806
Sq Ft
$343/Sq Ft
Est. Value
About This Home
This home is located at 21762 Goose Cross Terrace, Ashburn, VA 20147 and is currently estimated at $620,279, approximately $343 per square foot. 21762 Goose Cross Terrace is a home located in Loudoun County with nearby schools including Discovery Elementary School, Farmwell Station Middle School, and Broad Run High School.
Ownership History
Date
Name
Owned For
Owner Type
Purchase Details
Closed on
Feb 28, 2005
Sold by
Smith Duane
Bought by
Douroux Sybil A
Current Estimated Value
Home Financials for this Owner
Home Financials are based on the most recent Mortgage that was taken out on this home.
Original Mortgage
$327,200
Outstanding Balance
$167,199
Interest Rate
5.73%
Mortgage Type
New Conventional
Estimated Equity
$453,080
Purchase Details
Closed on
Sep 30, 2004
Sold by
Patterson Joshua D
Bought by
Smith Duane
Home Financials for this Owner
Home Financials are based on the most recent Mortgage that was taken out on this home.
Original Mortgage
$302,408
Interest Rate
5.81%
Mortgage Type
New Conventional
Purchase Details
Closed on
Oct 21, 2002
Sold by
Levent Adam
Bought by
Patterson Joshua D
Home Financials for this Owner
Home Financials are based on the most recent Mortgage that was taken out on this home.
Original Mortgage
$191,900
Interest Rate
6.18%
Create a Home Valuation Report for This Property
The Home Valuation Report is an in-depth analysis detailing your home's value as well as a comparison with similar homes in the area
Home Values in the Area
Average Home Value in this Area
Purchase History
| Date | Buyer | Sale Price | Title Company |
|---|---|---|---|
| Douroux Sybil A | $409,000 | -- | |
| Smith Duane | $378,010 | -- | |
| Patterson Joshua D | $239,900 | -- |
Source: Public Records
Mortgage History
| Date | Status | Borrower | Loan Amount |
|---|---|---|---|
| Open | Douroux Sybil A | $327,200 | |
| Previous Owner | Smith Duane | $302,408 | |
| Previous Owner | Patterson Joshua D | $191,900 |
Source: Public Records
Tax History Compared to Growth
Tax History
| Year | Tax Paid | Tax Assessment Tax Assessment Total Assessment is a certain percentage of the fair market value that is determined by local assessors to be the total taxable value of land and additions on the property. | Land | Improvement |
|---|---|---|---|---|
| 2025 | $4,608 | $572,400 | $185,000 | $387,400 |
| 2024 | $4,771 | $551,540 | $175,000 | $376,540 |
| 2023 | $4,410 | $504,010 | $175,000 | $329,010 |
| 2022 | $4,371 | $491,110 | $155,000 | $336,110 |
| 2021 | $4,197 | $428,230 | $155,000 | $273,230 |
| 2020 | $4,126 | $398,650 | $140,000 | $258,650 |
| 2019 | $3,955 | $378,480 | $140,000 | $238,480 |
| 2018 | $4,047 | $372,960 | $125,000 | $247,960 |
| 2017 | $3,953 | $351,370 | $125,000 | $226,370 |
| 2016 | $3,844 | $335,690 | $0 | $0 |
| 2015 | $3,814 | $211,050 | $0 | $211,050 |
| 2014 | $3,807 | $204,620 | $0 | $204,620 |
Source: Public Records
Map
Nearby Homes
- 21755 Ladyslipper Square
- 43740 Clear Lake Square
- 21825 Express Terrace Unit 110
- 21825 Express Terrace
- 21799 Express Terrace Unit 1122A
- 21795 Express Terrace Unit 1124
- 21789 Express Terrace
- 21787 Express Terrace
- 21783 Express Terrace Unit 1129A
- 43790 Metro Terrace Unit A
- 43769 Metro Terrace
- Hayes Plan at Ashburn Station
- Addison Homesite Special Plan at Ashburn Station
- 43791 Metro Terrace Unit B
- Addison Plan at Ashburn Station
- Elsdon Plan at The Flats at Waxpool Crossing
- Alverton Plan at The Flats at Waxpool Crossing
- Bellister Plan at The Flats at Waxpool Crossing
- Farleigh Plan at The Flats at Waxpool Crossing
- 43785 Transit Square
- 21760 Goose Cross Terrace
- 21764 Goose Cross Terrace
- 21766 Goose Cross Terrace
- 21758 Goose Cross Terrace
- 21768 Goose Cross Terrace
- 21770 Goose Cross Terrace
- 43698 Frogs Leap Terrace
- 21772 Goose Cross Terrace
- 43696 Frogs Leap Terrace
- 43694 Frogs Leap Terrace
- 43697 Frogs Leap Terrace
- 21767 Ladyslipper Square
- 43692 Frogs Leap Terrace
- 21776 Goose Cross Terrace
- 21769 Ladyslipper Square
- 21771 Ladyslipper Square
- 43695 Frogs Leap Terrace
- 21773 Ladyslipper Square
- 43690 Frogs Leap Terrace
- 21775 Ladyslipper Square