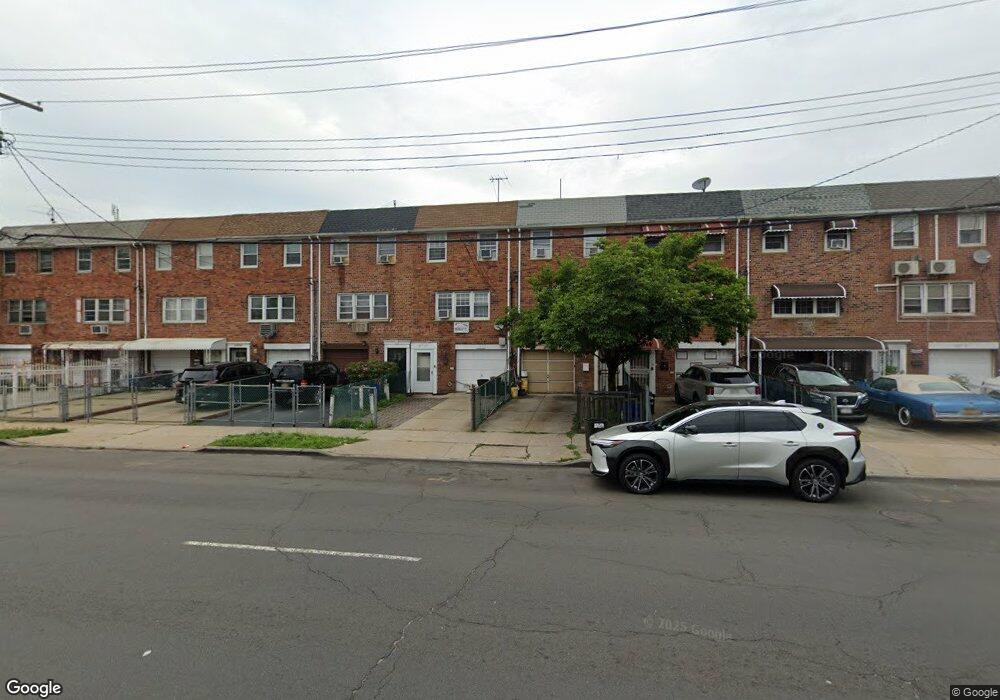
21763 Hempstead Ave Queens Village, NY 11429
Queens Village NeighborhoodEstimated Value: $625,759 - $749,000
--
Bed
--
Bath
1,432
Sq Ft
$470/Sq Ft
Est. Value
About This Home
This home is located at 21763 Hempstead Ave, Queens Village, NY 11429 and is currently estimated at $673,440, approximately $470 per square foot. 21763 Hempstead Ave is a home located in Queens County with nearby schools including P.S. 34 John Harvard, Jean Nuzzi Intermediate School, and Ss Joachim & Anne School.
Ownership History
Date
Name
Owned For
Owner Type
Purchase Details
Closed on
Jul 26, 2007
Sold by
Rameshwar Dhanraj
Bought by
Rameshwar Dhanraj and Rameshwar Nagamah
Current Estimated Value
Purchase Details
Closed on
Jul 26, 2006
Sold by
Marandola Kenneth
Bought by
Rameshwar Dhanraj
Home Financials for this Owner
Home Financials are based on the most recent Mortgage that was taken out on this home.
Original Mortgage
$73,000
Outstanding Balance
$43,696
Interest Rate
6.8%
Estimated Equity
$629,744
Purchase Details
Closed on
Jun 9, 1998
Sold by
Li Penku
Bought by
Marandola Kenneth
Home Financials for this Owner
Home Financials are based on the most recent Mortgage that was taken out on this home.
Original Mortgage
$91,000
Interest Rate
7.02%
Create a Home Valuation Report for This Property
The Home Valuation Report is an in-depth analysis detailing your home's value as well as a comparison with similar homes in the area
Home Values in the Area
Average Home Value in this Area
Purchase History
| Date | Buyer | Sale Price | Title Company |
|---|---|---|---|
| Rameshwar Dhanraj | -- | -- | |
| Rameshwar Dhanraj | -- | -- | |
| Rameshwar Dhanraj | $365,000 | -- | |
| Rameshwar Dhanraj | $365,000 | -- | |
| Marandola Kenneth | $130,000 | -- | |
| Marandola Kenneth | $130,000 | -- |
Source: Public Records
Mortgage History
| Date | Status | Borrower | Loan Amount |
|---|---|---|---|
| Open | Rameshwar Dhanraj | $73,000 | |
| Closed | Rameshwar Dhanraj | $73,000 | |
| Open | Rameshwar Dhanraj | $292,000 | |
| Closed | Rameshwar Dhanraj | $292,000 | |
| Previous Owner | Marandola Kenneth | $91,000 |
Source: Public Records
Tax History Compared to Growth
Tax History
| Year | Tax Paid | Tax Assessment Tax Assessment Total Assessment is a certain percentage of the fair market value that is determined by local assessors to be the total taxable value of land and additions on the property. | Land | Improvement |
|---|---|---|---|---|
| 2025 | $5,557 | $29,062 | $7,453 | $21,609 |
| 2024 | $5,557 | $27,667 | $7,212 | $20,455 |
| 2023 | $5,555 | $27,658 | $7,517 | $20,141 |
| 2022 | $5,209 | $29,220 | $9,540 | $19,680 |
| 2021 | $5,364 | $26,820 | $9,540 | $17,280 |
| 2020 | $5,126 | $26,160 | $9,540 | $16,620 |
| 2019 | $4,823 | $25,740 | $9,540 | $16,200 |
| 2018 | $4,698 | $23,048 | $8,254 | $14,794 |
| 2017 | $4,433 | $21,744 | $9,319 | $12,425 |
| 2016 | $4,246 | $21,744 | $9,319 | $12,425 |
| 2015 | $2,254 | $20,182 | $10,177 | $10,005 |
| 2014 | $2,254 | $19,214 | $10,595 | $8,619 |
Source: Public Records
Map
Nearby Homes
- 21727 Hempstead Ave
- 217-27 99th Ave
- 99-10 218th St
- 218-25 101st Ave
- 102-05 217th St
- 218-17 104th Ave
- 217-05 104th Ave
- 102-20 218th Place
- 218-27 99th Ave
- 218-34 104th Ave
- 21609 104th Ave
- 10218 216th St
- 99-23 215th St
- 225 15 106th Ave
- 104 39 210 St
- 10418 216th St
- 106-14 217th St
- 219-06 101st Ave
- 94-86 218th St
- 9911 213th St
- 217-65 Hempstead Ave
- 21761 Hempstead Ave
- 21765 Hempstead Ave
- 21767 Hempstead Ave
- 21767 Hempstead Ave
- 21759 Hempstead Ave
- 21769 Hempstead Ave
- 21757 Hempstead Ave
- 21755 Hempstead Ave
- 21771 Hempstead Ave
- 21773 Hempstead Ave
- 21753 Hempstead Ave
- 21752 100th Ave
- 21754 100th Ave
- 217-54 100th Ave
- 21775 Hempstead Ave
- 21751 Hempstead Ave
- 21756 100th Ave
- 21748 100th Ave
- 217-77 Hempstead Ave