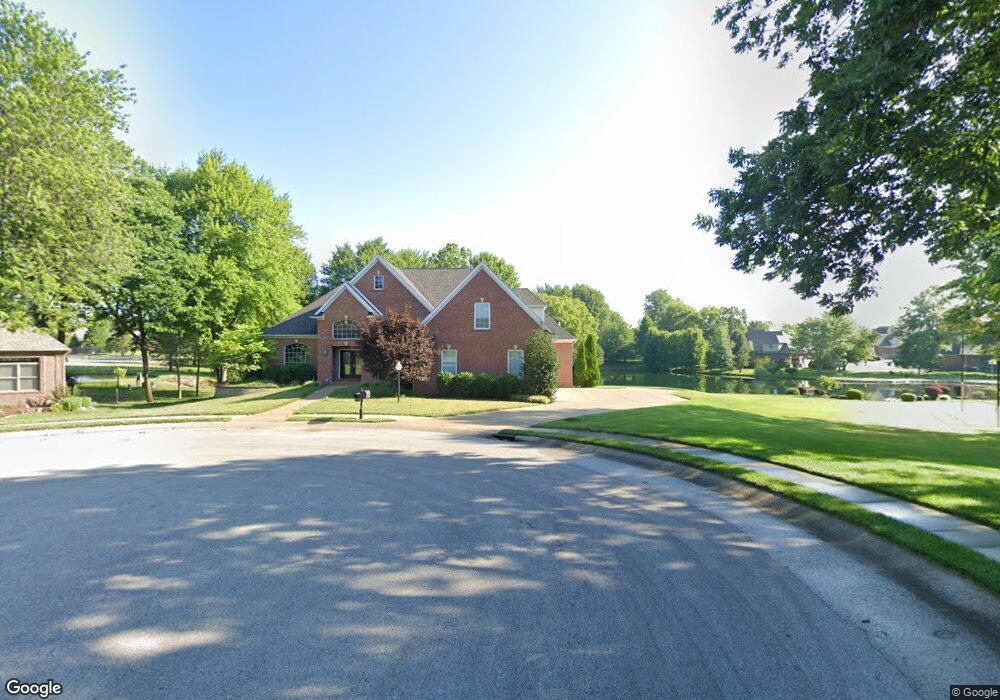
2177 Glenstone Ct Newburgh, IN 47630
Estimated Value: $828,000 - $960,670
5
Beds
5
Baths
3,606
Sq Ft
$243/Sq Ft
Est. Value
About This Home
This home is located at 2177 Glenstone Ct, Newburgh, IN 47630 and is currently estimated at $877,918, approximately $243 per square foot. 2177 Glenstone Ct is a home located in Warrick County with nearby schools including John H. Castle Elementary School, Castle North Middle School, and Castle High School.
Ownership History
Date
Name
Owned For
Owner Type
Purchase Details
Closed on
Aug 3, 2012
Sold by
Schymik Brian W
Bought by
Schymik Brian W and Schymik Ann W
Current Estimated Value
Purchase Details
Closed on
Oct 28, 2011
Sold by
Rogers Samuel G and Rogers Cathy
Bought by
Schymik Brian W
Home Financials for this Owner
Home Financials are based on the most recent Mortgage that was taken out on this home.
Original Mortgage
$417,000
Outstanding Balance
$42,174
Interest Rate
4.02%
Mortgage Type
New Conventional
Estimated Equity
$835,744
Purchase Details
Closed on
Oct 14, 2005
Sold by
Hanson David L and Hanson Tonya E
Bought by
Rogers Samuel G and Rogers Cathy
Create a Home Valuation Report for This Property
The Home Valuation Report is an in-depth analysis detailing your home's value as well as a comparison with similar homes in the area
Home Values in the Area
Average Home Value in this Area
Purchase History
| Date | Buyer | Sale Price | Title Company |
|---|---|---|---|
| Schymik Brian W | -- | Lockyear Title Llc | |
| Schymik Brian W | -- | Lockyear Title Llc | |
| Rogers Samuel G | -- | None Available |
Source: Public Records
Mortgage History
| Date | Status | Borrower | Loan Amount |
|---|---|---|---|
| Open | Schymik Brian W | $417,000 |
Source: Public Records
Tax History Compared to Growth
Tax History
| Year | Tax Paid | Tax Assessment Tax Assessment Total Assessment is a certain percentage of the fair market value that is determined by local assessors to be the total taxable value of land and additions on the property. | Land | Improvement |
|---|---|---|---|---|
| 2024 | $6,452 | $748,800 | $77,900 | $670,900 |
| 2023 | $6,361 | $744,500 | $62,500 | $682,000 |
| 2022 | $6,829 | $749,100 | $62,500 | $686,600 |
| 2021 | $5,829 | $614,700 | $62,500 | $552,200 |
| 2020 | $5,854 | $595,100 | $55,200 | $539,900 |
| 2019 | $5,758 | $581,700 | $55,200 | $526,500 |
| 2018 | $5,307 | $553,000 | $55,200 | $497,800 |
| 2017 | $7,452 | $515,900 | $55,200 | $460,700 |
| 2016 | $4,873 | $516,600 | $55,200 | $461,400 |
| 2014 | $4,699 | $524,200 | $55,300 | $468,900 |
| 2013 | $4,949 | $560,900 | $77,400 | $483,500 |
Source: Public Records
Map
Nearby Homes
- 2055 Claybrook Ct
- 6511 Venice Dr
- 2886 Glen Lake Dr
- 2677 Briarcliff Dr
- 1711 Old Plank Rd
- 1499 Woodfield Dr
- 2800 Briarcliff Dr
- 1469 Woodfield Dr
- 2230 Long Cove Cir
- 1822 Fuquay Rd
- 2235 Long Cove Cir
- 1844 Fuquay Rd
- 1688 Fuquay Rd
- 7377 Castle Hills Dr
- 7500 Tyring Rd
- 7422 Bosma Dr
- 6855 Russell Place
- 7833 Brownwood Dr
- 7555 Gourley Ln
- 6293 Pavilion Dr
- 6055 Woodbridge Trail
- 2199 Glenstone Ct
- 2211 Glenstone Ct
- 6033 Woodbridge Trail
- 2222 Glenstone Ct
- 2199 Ledgewood Dr
- 2011 Claybrook Ct
- 2177 Ledgewood Dr
- 2211 Ledgewood Dr
- 6011 Woodbridge Trail
- 1999 Claybrook Ct
- 6055 Laurel Ridge Dr
- 6044 Woodbridge Trail
- 6047 Laurel Ridge Dr
- 6077 Laurel Ridge Dr
- 6033 Laurel Ridge Dr
- 6100 Laurel Ridge Dr
- 2033 Claybrook Ct
- 5999 Woodbridge Trail
- 2222 Ledgewood Dr