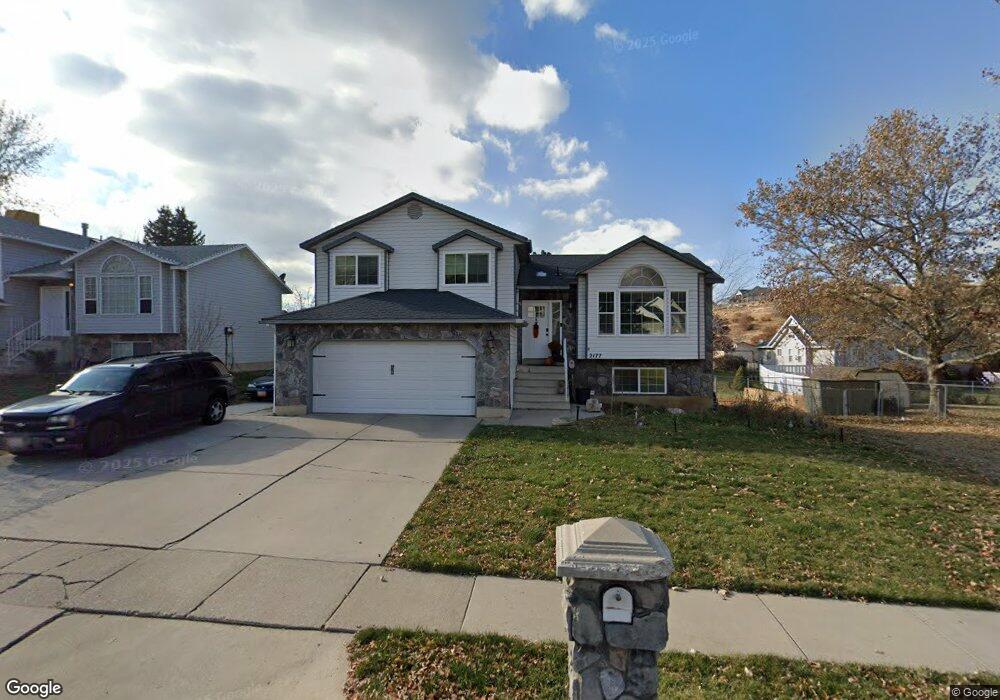
2177 N 1600 E Layton, UT 84040
Estimated Value: $501,000 - $544,102
5
Beds
3
Baths
2,030
Sq Ft
$260/Sq Ft
Est. Value
About This Home
This home is located at 2177 N 1600 E, Layton, UT 84040 and is currently estimated at $527,276, approximately $259 per square foot. 2177 N 1600 E is a home located in Davis County with nearby schools including Sarah Jane Adams Elementary School, North Layton Junior High School, and Northridge High School.
Ownership History
Date
Name
Owned For
Owner Type
Purchase Details
Closed on
Apr 29, 2021
Sold by
Shupe Donna Maria
Bought by
Thompson Julie and Thompson Jalen
Current Estimated Value
Home Financials for this Owner
Home Financials are based on the most recent Mortgage that was taken out on this home.
Original Mortgage
$427,121
Outstanding Balance
$386,254
Interest Rate
3.1%
Mortgage Type
FHA
Estimated Equity
$141,022
Purchase Details
Closed on
Dec 23, 2019
Sold by
Manfull Merrill D and Manfull Jill C
Bought by
Shupe Donna Maria
Home Financials for this Owner
Home Financials are based on the most recent Mortgage that was taken out on this home.
Original Mortgage
$323,000
Interest Rate
3.6%
Mortgage Type
New Conventional
Purchase Details
Closed on
Jul 12, 2017
Sold by
Hall Jill C
Bought by
Manfull Merrill D
Purchase Details
Closed on
Sep 30, 2003
Sold by
Hall Cameron F and Hall Jill C
Bought by
Hall Jill C
Create a Home Valuation Report for This Property
The Home Valuation Report is an in-depth analysis detailing your home's value as well as a comparison with similar homes in the area
Home Values in the Area
Average Home Value in this Area
Purchase History
| Date | Buyer | Sale Price | Title Company |
|---|---|---|---|
| Thompson Julie | -- | Old Republic Natl | |
| Shupe Donna Maria | -- | Old Republic Natl Ti | |
| Manfull Merrill D | -- | -- | |
| Hall Jill C | -- | -- |
Source: Public Records
Mortgage History
| Date | Status | Borrower | Loan Amount |
|---|---|---|---|
| Open | Thompson Julie | $427,121 | |
| Previous Owner | Shupe Donna Maria | $323,000 |
Source: Public Records
Tax History
| Year | Tax Paid | Tax Assessment Tax Assessment Total Assessment is a certain percentage of the fair market value that is determined by local assessors to be the total taxable value of land and additions on the property. | Land | Improvement |
|---|---|---|---|---|
| 2025 | $2,770 | $266,200 | $126,524 | $139,676 |
| 2024 | $2,639 | $257,401 | $150,002 | $107,399 |
| 2023 | $2,569 | $446,000 | $201,486 | $244,514 |
| 2022 | $2,664 | $253,000 | $108,144 | $144,856 |
| 2021 | $2,513 | $356,000 | $164,692 | $191,308 |
| 2020 | $2,286 | $310,000 | $133,778 | $176,222 |
| 2019 | $2,053 | $273,000 | $119,412 | $153,588 |
| 2018 | $1,859 | $248,000 | $78,123 | $169,877 |
| 2016 | $1,665 | $116,655 | $37,767 | $78,888 |
| 2015 | $1,560 | $104,280 | $37,767 | $66,513 |
| 2014 | $1,595 | $109,988 | $37,767 | $72,221 |
| 2013 | -- | $103,872 | $29,748 | $74,124 |
Source: Public Records
Map
Nearby Homes
- 2096 N 1450 E
- 1540 E Primrose Ln
- 1465 E Sego Lily Ct
- 1444 E 2400 N
- 1930 N Camellia Way E Unit 407
- 1920 N Camellia Way Unit 406
- 1099 E 2125 N
- 1120 E 2200 N
- 1476 Kays Creek Dr
- 2189 N 1950 E
- 3142 E Thorley Dr
- 2315 N 1075 E
- 1305 E Larkspur Way
- 1266 E Larkspur Way
- 1354 E Hollyhock Way
- 1340 E Hollyhock Way
- 1252 E Larkspur Way
- 2273 N 1975 E
- 1843 Hayes Dr
- 2340 N 2050 E
Your Personal Tour Guide
Ask me questions while you tour the home.