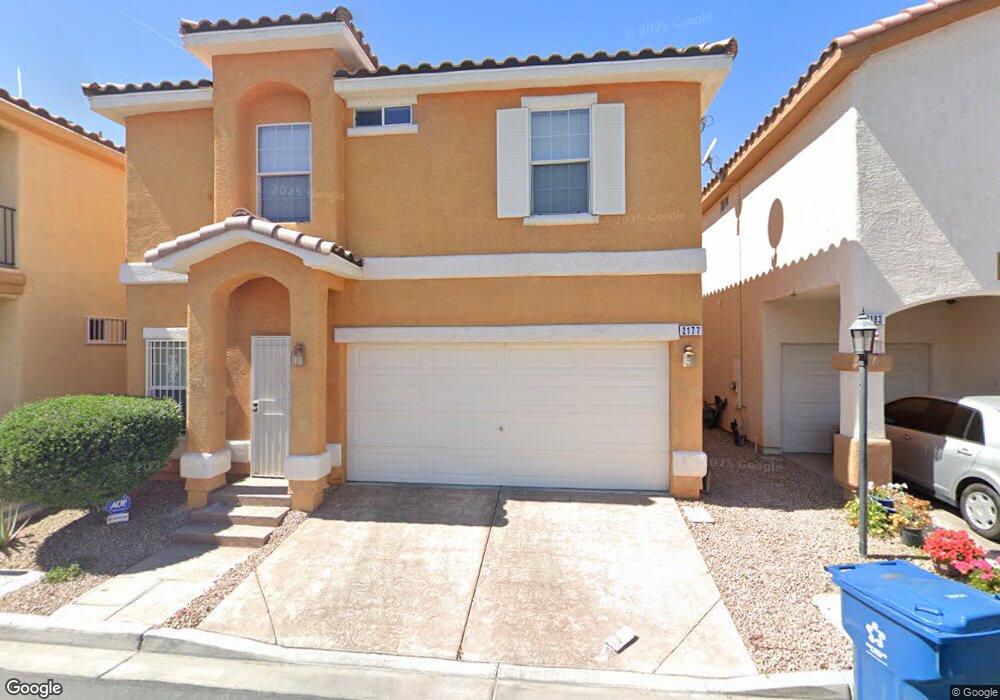
2177 Tiberio Way Las Vegas, NV 89156
Estimated Value: $321,000 - $361,000
3
Beds
3
Baths
1,512
Sq Ft
$223/Sq Ft
Est. Value
About This Home
This home is located at 2177 Tiberio Way, Las Vegas, NV 89156 and is currently estimated at $336,537, approximately $222 per square foot. 2177 Tiberio Way is a home located in Clark County with nearby schools including Martin Luther King Jr. Elementary School, Dr. William H. Bailey Middle School, and Sunrise Mountain High School.
Ownership History
Date
Name
Owned For
Owner Type
Purchase Details
Closed on
Mar 19, 2012
Sold by
Deleon Orlando
Bought by
Deleon Orlando and Perez Marcelina Moreno
Current Estimated Value
Purchase Details
Closed on
Oct 15, 2009
Sold by
Us Bank National Association
Bought by
Deleon Orlando
Home Financials for this Owner
Home Financials are based on the most recent Mortgage that was taken out on this home.
Original Mortgage
$65,715
Interest Rate
4.88%
Mortgage Type
FHA
Purchase Details
Closed on
Jul 17, 2009
Sold by
Dejesus Edward
Bought by
Us Bank National Association
Purchase Details
Closed on
Feb 24, 2006
Sold by
Monte Bello Development Llc
Bought by
Dejesus Edward
Home Financials for this Owner
Home Financials are based on the most recent Mortgage that was taken out on this home.
Original Mortgage
$196,292
Interest Rate
7.95%
Create a Home Valuation Report for This Property
The Home Valuation Report is an in-depth analysis detailing your home's value as well as a comparison with similar homes in the area
Home Values in the Area
Average Home Value in this Area
Purchase History
| Date | Buyer | Sale Price | Title Company |
|---|---|---|---|
| Deleon Orlando | -- | None Available | |
| Deleon Orlando | $69,000 | Chicago Title Las Vegas | |
| Us Bank National Association | $77,000 | Fidelity National Default So | |
| Dejesus Edward | $245,365 | Chicago Title |
Source: Public Records
Mortgage History
| Date | Status | Borrower | Loan Amount |
|---|---|---|---|
| Previous Owner | Deleon Orlando | $65,715 | |
| Previous Owner | Dejesus Edward | $196,292 |
Source: Public Records
Tax History Compared to Growth
Tax History
| Year | Tax Paid | Tax Assessment Tax Assessment Total Assessment is a certain percentage of the fair market value that is determined by local assessors to be the total taxable value of land and additions on the property. | Land | Improvement |
|---|---|---|---|---|
| 2025 | $839 | $89,235 | $24,500 | $64,735 |
| 2024 | $815 | $89,235 | $24,500 | $64,735 |
| 2023 | $815 | $84,314 | $23,450 | $60,864 |
| 2022 | $791 | $75,838 | $20,300 | $55,538 |
| 2021 | $768 | $70,241 | $17,500 | $52,741 |
| 2020 | $743 | $61,892 | $17,500 | $44,392 |
| 2019 | $721 | $61,666 | $14,000 | $47,666 |
| 2018 | $700 | $51,066 | $10,850 | $40,216 |
| 2017 | $665 | $46,691 | $10,500 | $36,191 |
| 2016 | $665 | $36,097 | $7,000 | $29,097 |
| 2015 | $662 | $35,746 | $4,200 | $31,546 |
| 2014 | $642 | $21,219 | $3,500 | $17,719 |
Source: Public Records
Map
Nearby Homes
- 2130 Trebbiano Way
- 5180 Starter Ave
- 5207 Paradise Valley Ave
- 5280 Shreve Ave
- 5275 Starter Ave
- 5320 Meikle Ln
- 2176 N Christy Ln
- 0 Meikle Ln
- 1739 N Lamont St
- 2232 N Tomlinson Ln
- 4650 E Lake Mead Blvd Unit 20
- 4650 E Lake Mead Blvd Unit 123
- 4650 E Lake Mead Blvd Unit 120
- 4650 E Lake Mead Blvd Unit 82
- 4650 E Lake Mead Blvd Unit 95
- 4650 E Lake Mead Blvd Unit 65
- 4650 E Lake Mead Blvd Unit 73
- 4650 E Lake Mead Blvd Unit 35
- 4650 E Lake Mead Blvd Unit 113
- 4182 E Lake Mead Blvd
- 2171 Tiberio Way
- 2183 Tiberio Way
- 2165 Tiberio Way
- 5115 Piazza Cavour Dr
- 5116 Bellaria Place
- 5123 Piazza Cavour Dr
- 5124 Bellaria Place
- 5110 Piazza Cavour Dr
- 5117 Bellaria Place
- 5118 Piazza Cavour Dr
- 5118 Piazza Cavour Dr Unit n/a
- 5131 Piazza Cavour Dr
- 5132 Bellaria Place
- 2147 Tiberio Way
- 5125 Bellaria Place
- 5126 Piazza Cavour Dr
- 5140 Bellaria Place
- 5118 Longiano Place
- 5139 Piazza Cavour Dr
- 5140 Bellaria Place