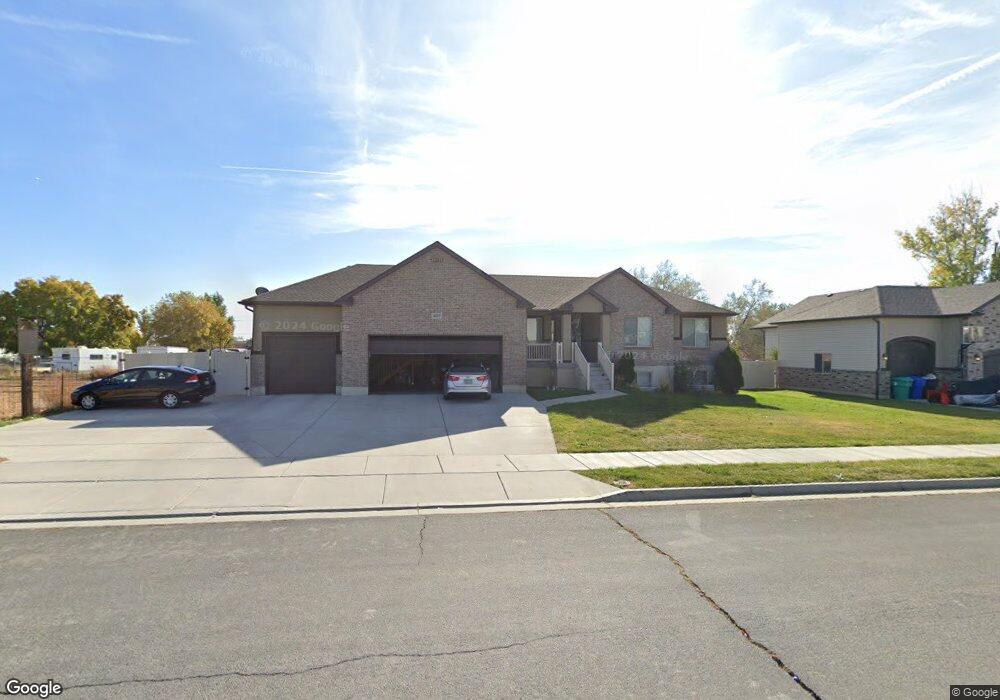
2177 W 375 N Unit 10 West Point, UT 84015
Estimated Value: $583,000 - $627,000
3
Beds
2
Baths
1,668
Sq Ft
$364/Sq Ft
Est. Value
About This Home
This home is located at 2177 W 375 N Unit 10, West Point, UT 84015 and is currently estimated at $607,719, approximately $364 per square foot. 2177 W 375 N Unit 10 is a home located in Davis County with nearby schools including Lakeside School, West Point Junior High School, and Syracuse High School.
Ownership History
Date
Name
Owned For
Owner Type
Purchase Details
Closed on
Oct 18, 2024
Sold by
Martinez Charles and Martinez Charles P
Bought by
Martinez Charles P and Shafer Hope
Current Estimated Value
Home Financials for this Owner
Home Financials are based on the most recent Mortgage that was taken out on this home.
Original Mortgage
$150,000
Outstanding Balance
$148,378
Interest Rate
6.2%
Mortgage Type
Credit Line Revolving
Estimated Equity
$459,341
Purchase Details
Closed on
May 31, 2016
Sold by
Clifford Tage B and Clifford Lauren
Bought by
Martinez Charles and Shafer Hope
Purchase Details
Closed on
Aug 20, 2012
Sold by
Nd Development Llc
Bought by
Clifford Tage B and Clifford Lauren
Home Financials for this Owner
Home Financials are based on the most recent Mortgage that was taken out on this home.
Original Mortgage
$219,863
Interest Rate
3.56%
Mortgage Type
Construction
Create a Home Valuation Report for This Property
The Home Valuation Report is an in-depth analysis detailing your home's value as well as a comparison with similar homes in the area
Home Values in the Area
Average Home Value in this Area
Purchase History
| Date | Buyer | Sale Price | Title Company |
|---|---|---|---|
| Martinez Charles P | -- | First American Title | |
| Martinez Charles | -- | Mountain View Title & Escrow | |
| Clifford Tage B | -- | Backman Title Servic |
Source: Public Records
Mortgage History
| Date | Status | Borrower | Loan Amount |
|---|---|---|---|
| Open | Martinez Charles P | $150,000 | |
| Previous Owner | Clifford Tage B | $219,863 |
Source: Public Records
Tax History Compared to Growth
Tax History
| Year | Tax Paid | Tax Assessment Tax Assessment Total Assessment is a certain percentage of the fair market value that is determined by local assessors to be the total taxable value of land and additions on the property. | Land | Improvement |
|---|---|---|---|---|
| 2025 | $3,287 | $308,000 | $109,785 | $198,215 |
| 2024 | $3,149 | $296,450 | $98,854 | $197,596 |
| 2023 | $2,922 | $506,000 | $122,262 | $383,738 |
| 2022 | $3,163 | $299,750 | $63,331 | $236,419 |
| 2021 | $2,976 | $422,000 | $99,985 | $322,015 |
| 2020 | $2,623 | $367,000 | $83,807 | $283,193 |
| 2019 | $2,508 | $346,000 | $81,365 | $264,635 |
| 2018 | $2,383 | $324,000 | $81,784 | $242,216 |
| 2016 | $2,306 | $165,000 | $31,626 | $133,374 |
| 2015 | $2,137 | $144,870 | $31,626 | $113,244 |
| 2014 | $1,950 | $134,087 | $31,626 | $102,461 |
| 2013 | -- | $120,922 | $33,309 | $87,613 |
Source: Public Records
Map
Nearby Homes