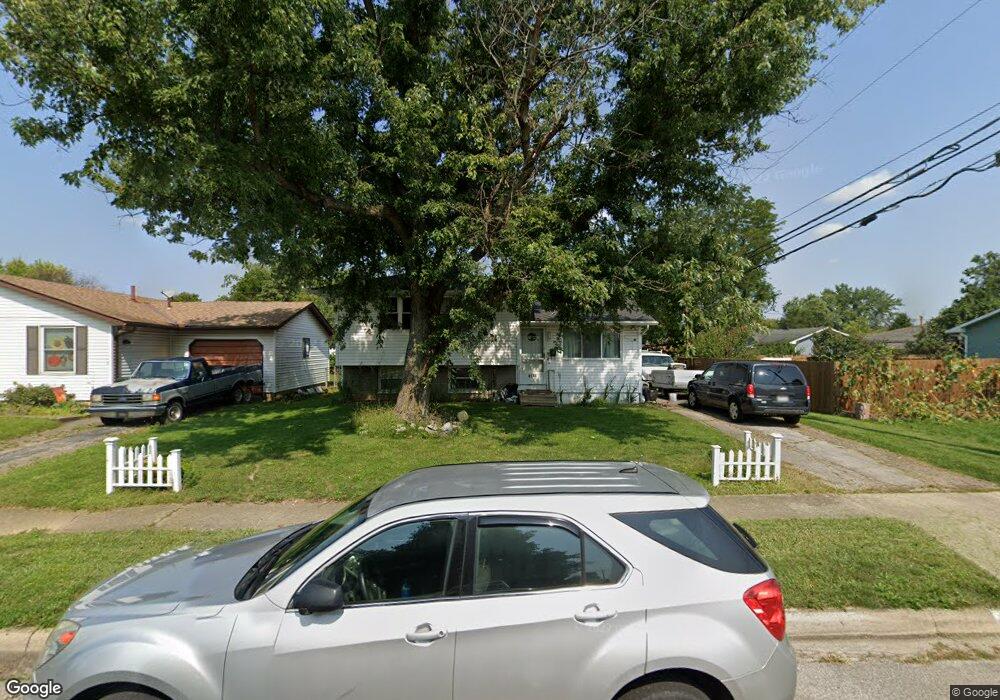
2178 Brookfield Rd Columbus, OH 43229
Forest Park East NeighborhoodEstimated Value: $203,000 - $249,000
3
Beds
1
Bath
924
Sq Ft
$243/Sq Ft
Est. Value
About This Home
This home is located at 2178 Brookfield Rd, Columbus, OH 43229 and is currently estimated at $224,269, approximately $242 per square foot. 2178 Brookfield Rd is a home located in Franklin County with nearby schools including Avalon Elementary School, Northgate Intermediate, and Woodward Park Middle School.
Ownership History
Date
Name
Owned For
Owner Type
Purchase Details
Closed on
Sep 12, 2023
Sold by
Hoppes Diane Marie
Bought by
Diane Marie Hoppes Declaration Of Trust and Hoppes
Current Estimated Value
Purchase Details
Closed on
May 12, 2015
Sold by
Fagley Linda and Fagley Robert
Bought by
Hoppes Diane
Home Financials for this Owner
Home Financials are based on the most recent Mortgage that was taken out on this home.
Original Mortgage
$61,200
Interest Rate
3.65%
Mortgage Type
New Conventional
Purchase Details
Closed on
Feb 18, 2015
Sold by
Skiba Joyce
Bought by
Hoppes Diane
Home Financials for this Owner
Home Financials are based on the most recent Mortgage that was taken out on this home.
Original Mortgage
$61,200
Interest Rate
3.65%
Mortgage Type
New Conventional
Purchase Details
Closed on
Dec 4, 2009
Sold by
Skiba Mildred S
Bought by
Skiba Joyce and Skiba Gail
Purchase Details
Closed on
Apr 22, 1974
Bought by
Skiba Mildred S
Create a Home Valuation Report for This Property
The Home Valuation Report is an in-depth analysis detailing your home's value as well as a comparison with similar homes in the area
Home Values in the Area
Average Home Value in this Area
Purchase History
| Date | Buyer | Sale Price | Title Company |
|---|---|---|---|
| Diane Marie Hoppes Declaration Of Trust | -- | None Listed On Document | |
| Hoppes Diane | $14,800 | None Available | |
| Hoppes Diane | $14,800 | None Available | |
| Hoppes Diane | $14,800 | None Available | |
| Hoppes Diane | $14,800 | None Available | |
| Skiba Joyce | -- | None Available | |
| Skiba Mildred S | -- | -- |
Source: Public Records
Mortgage History
| Date | Status | Borrower | Loan Amount |
|---|---|---|---|
| Previous Owner | Hoppes Diane | $61,200 | |
| Previous Owner | Hoppes Diane | $61,200 |
Source: Public Records
Tax History Compared to Growth
Tax History
| Year | Tax Paid | Tax Assessment Tax Assessment Total Assessment is a certain percentage of the fair market value that is determined by local assessors to be the total taxable value of land and additions on the property. | Land | Improvement |
|---|---|---|---|---|
| 2024 | $3,142 | $70,010 | $17,890 | $52,120 |
| 2023 | $3,102 | $70,010 | $17,890 | $52,120 |
| 2022 | $2,360 | $45,500 | $11,340 | $34,160 |
| 2021 | $2,466 | $45,500 | $11,340 | $34,160 |
| 2020 | $2,367 | $45,500 | $11,340 | $34,160 |
| 2019 | $2,092 | $34,480 | $8,400 | $26,080 |
| 2018 | $1,946 | $34,480 | $8,400 | $26,080 |
| 2017 | $2,039 | $34,480 | $8,400 | $26,080 |
| 2016 | $2,001 | $30,000 | $7,490 | $22,510 |
| 2015 | $1,804 | $30,000 | $7,490 | $22,510 |
| 2014 | $1,860 | $30,000 | $7,490 | $22,510 |
| 2013 | $679 | $31,570 | $7,875 | $23,695 |
Source: Public Records
Map
Nearby Homes
- 2084 Brookfield Rd
- 5522 Parkshire Dr Unit 5522
- 5556 Parkshire Dr Unit 5556
- 5578 Parkshire Dr Unit 5578
- 5726 Beechcroft Rd Unit J
- 2294 Teakwood Dr
- 5732 Beechcroft Rd Unit B
- 1914 Walden Dr
- 1881 Brimfield Rd
- 2250 Webster Canyon Ct
- 5204 Honeytree Loop W
- 5485 Tamarack Blvd
- 1752 Pine Tree St S Unit H
- 5727 Tamarack Blvd Unit A
- 1743 Pine Tree St N Unit A
- 1722 Blue Ash Place
- 2500 Maplewood Dr
- 6019 Beechcroft Rd
- 1687 Brookfield Square S
- 2058 Northcliff Dr
- 2172 Brookfield Rd
- 2190 Brookfield Rd
- 5547 Aqua St
- 2164 Brookfield Rd
- 2169 Shawbury Ct E
- 5553 Aqua St
- 2158 Brookfield Rd
- 2161 Shawbury Ct E
- 2179 Brookfield Rd
- 2185 Brookfield Rd
- 2171 Brookfield Rd
- 5561 Aqua St
- 2163 Brookfield Rd
- 2193 Brookfield Rd
- 2153 Shawbury Ct E
- 2155 Brookfield Rd
- 5569 Aqua St
- 2144 Brookfield Rd
- 2145 Shawbury Ct E
- 5538 Aqua St