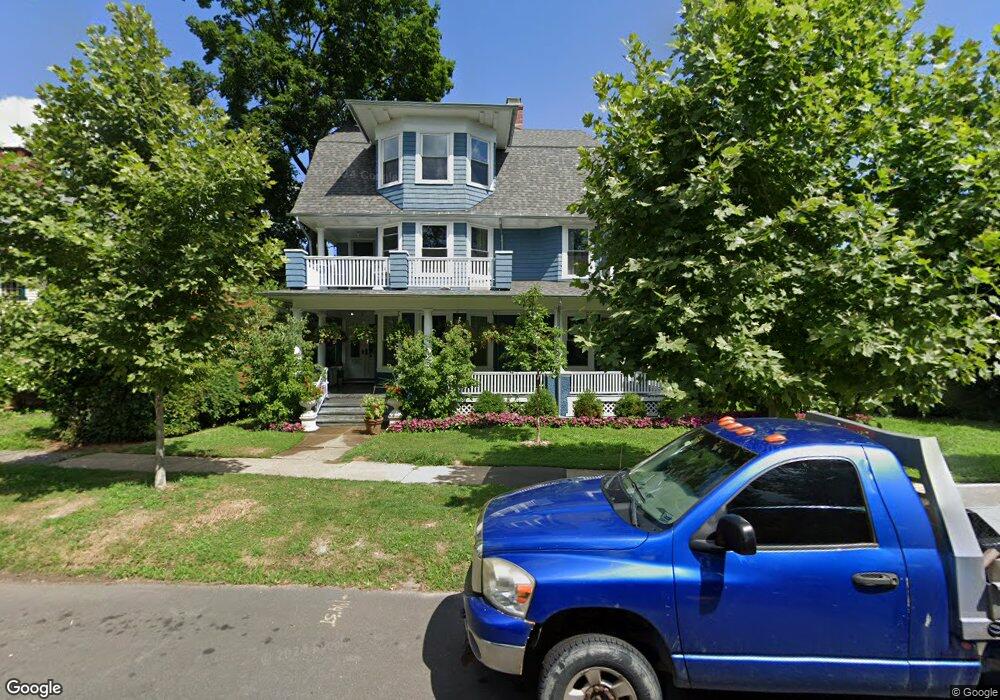
2178 Elm St Unit 2ND F Stratford, CT 06615
Stratford Center Historic District NeighborhoodEstimated Value: $350,000 - $796,000
4
Beds
2
Baths
1,400
Sq Ft
$453/Sq Ft
Est. Value
About This Home
This home is located at 2178 Elm St Unit 2ND F, Stratford, CT 06615 and is currently estimated at $634,211, approximately $453 per square foot. 2178 Elm St Unit 2ND F is a home located in Fairfield County with nearby schools including Stratford Academy - Johnson House, David Wooster Middle School, and Stratford High School.
Ownership History
Date
Name
Owned For
Owner Type
Purchase Details
Closed on
May 27, 2020
Sold by
Vitorino James and Vitorino Kiki T
Bought by
Squitieri Frederick
Current Estimated Value
Purchase Details
Closed on
Oct 1, 2014
Sold by
Est Kucej Joanne L and Kucej John C
Bought by
Vitorino James and Vitorino Kiki T
Home Financials for this Owner
Home Financials are based on the most recent Mortgage that was taken out on this home.
Original Mortgage
$195,000
Interest Rate
4.11%
Purchase Details
Closed on
Oct 14, 1992
Sold by
Goodrich Matthew
Bought by
Kucej John
Home Financials for this Owner
Home Financials are based on the most recent Mortgage that was taken out on this home.
Original Mortgage
$156,000
Interest Rate
6.2%
Mortgage Type
Unknown
Purchase Details
Closed on
Aug 28, 1990
Sold by
Robson Ruth
Bought by
Goodrich George
Home Financials for this Owner
Home Financials are based on the most recent Mortgage that was taken out on this home.
Original Mortgage
$157,500
Interest Rate
10.01%
Create a Home Valuation Report for This Property
The Home Valuation Report is an in-depth analysis detailing your home's value as well as a comparison with similar homes in the area
Home Values in the Area
Average Home Value in this Area
Purchase History
| Date | Buyer | Sale Price | Title Company |
|---|---|---|---|
| Squitieri Frederick | $495,000 | None Available | |
| Vitorino James | $260,000 | -- | |
| Kucej John | $48,750 | -- | |
| Kucej John | $146,250 | -- | |
| Goodrich George | $175,000 | -- |
Source: Public Records
Mortgage History
| Date | Status | Borrower | Loan Amount |
|---|---|---|---|
| Previous Owner | Vitorino James | $195,000 | |
| Previous Owner | Goodrich George | $156,000 | |
| Previous Owner | Goodrich George | $157,500 |
Source: Public Records
Tax History Compared to Growth
Tax History
| Year | Tax Paid | Tax Assessment Tax Assessment Total Assessment is a certain percentage of the fair market value that is determined by local assessors to be the total taxable value of land and additions on the property. | Land | Improvement |
|---|---|---|---|---|
| 2025 | $10,620 | $264,180 | $63,000 | $201,180 |
| 2024 | $10,620 | $264,180 | $63,000 | $201,180 |
| 2023 | $11,132 | $276,920 | $63,000 | $213,920 |
| 2022 | $10,927 | $276,920 | $63,000 | $213,920 |
| 2021 | $10,930 | $276,920 | $63,000 | $213,920 |
| 2020 | $10,977 | $276,920 | $63,000 | $213,920 |
| 2019 | $10,271 | $257,600 | $57,260 | $200,340 |
| 2018 | $10,278 | $257,600 | $57,260 | $200,340 |
| 2017 | $10,296 | $257,600 | $57,260 | $200,340 |
| 2016 | $8,857 | $227,150 | $57,260 | $169,890 |
| 2015 | $7,939 | $214,690 | $57,260 | $157,430 |
| 2014 | $8,374 | $235,030 | $82,950 | $152,080 |
Source: Public Records
Map
Nearby Homes
- 758 Judson Place
- 126 Blakeman Place
- 156 Blakeman Place
- 1853 Main St
- 40 California St Unit A20
- 40 California St Unit B9
- 164 Hamilton Ave Unit 4
- 204 California St
- 1167 South Ave
- 50 Birdseye St Unit 101
- 50 Birdseye St Unit 104
- 1460 Elm St Unit 225
- 1460 Elm St Unit 322
- 1460 Elm St Unit 132
- 54 Vernon St
- 89 Vernon St
- 17 Miranda Ln
- 250 Rockwell Ave
- 240 Placid Ave
- 51 Winfield Dr