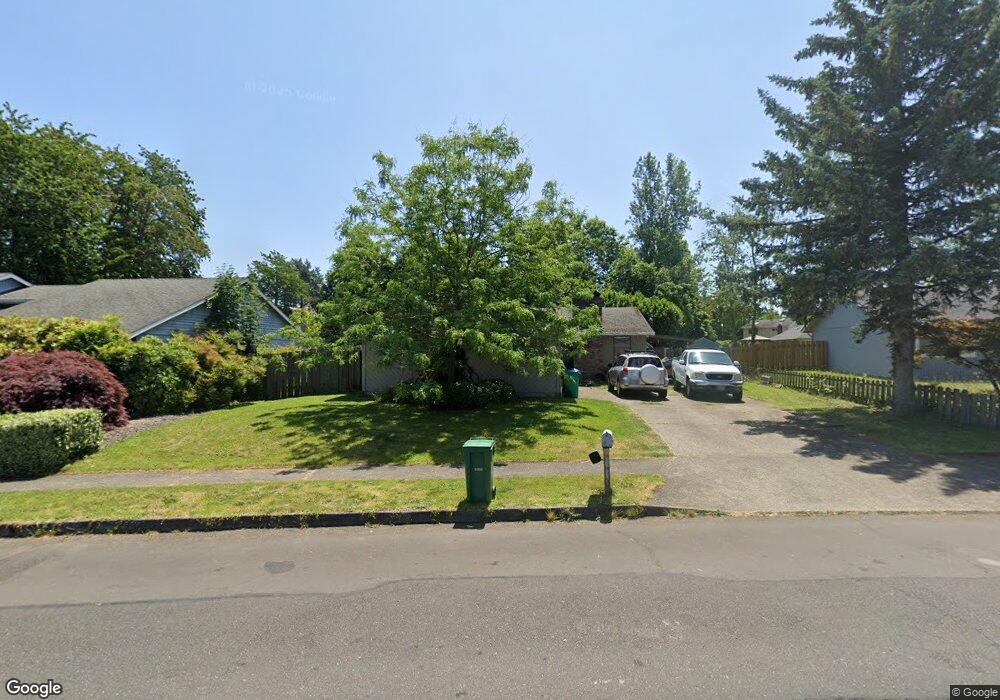
2178 NE 38th Dr Gresham, OR 97030
North Central NeighborhoodEstimated Value: $404,000 - $454,000
2
Beds
2
Baths
1,292
Sq Ft
$340/Sq Ft
Est. Value
About This Home
This home is located at 2178 NE 38th Dr, Gresham, OR 97030 and is currently estimated at $439,317, approximately $340 per square foot. 2178 NE 38th Dr is a home located in Multnomah County with nearby schools including Woodland Elementary School, Walt Morey Middle School, and Reynolds High School.
Ownership History
Date
Name
Owned For
Owner Type
Purchase Details
Closed on
Sep 28, 2011
Sold by
Herron Travis M
Bought by
Dorsey Bret P
Current Estimated Value
Home Financials for this Owner
Home Financials are based on the most recent Mortgage that was taken out on this home.
Original Mortgage
$155,894
Outstanding Balance
$105,493
Interest Rate
4.09%
Mortgage Type
FHA
Estimated Equity
$333,824
Purchase Details
Closed on
Nov 21, 2006
Sold by
Shannon Michael P
Bought by
Herron Patricia Joyce and Herron Travis Michael
Home Financials for this Owner
Home Financials are based on the most recent Mortgage that was taken out on this home.
Original Mortgage
$198,350
Interest Rate
7.55%
Mortgage Type
Stand Alone First
Purchase Details
Closed on
Mar 13, 2006
Sold by
Carroll Alice
Bought by
Shannon Michael P and Shannon Donna R
Purchase Details
Closed on
Mar 25, 1999
Sold by
Carroll Alice
Bought by
Carroll Alice and The Carroll Living Trust
Purchase Details
Closed on
Apr 13, 1998
Sold by
Carroll Alice
Bought by
Carroll Alice
Create a Home Valuation Report for This Property
The Home Valuation Report is an in-depth analysis detailing your home's value as well as a comparison with similar homes in the area
Home Values in the Area
Average Home Value in this Area
Purchase History
| Date | Buyer | Sale Price | Title Company |
|---|---|---|---|
| Dorsey Bret P | $159,950 | Fidelity Natl Title Co Of Or | |
| Herron Patricia Joyce | $247,947 | Ticor Title Insurance Compan | |
| Shannon Michael P | $165,000 | Ticor Title Insurance Compan | |
| Carroll Alice | -- | -- | |
| Carroll Alice | -- | -- |
Source: Public Records
Mortgage History
| Date | Status | Borrower | Loan Amount |
|---|---|---|---|
| Open | Dorsey Bret P | $155,894 | |
| Previous Owner | Herron Patricia Joyce | $198,350 |
Source: Public Records
Tax History
| Year | Tax Paid | Tax Assessment Tax Assessment Total Assessment is a certain percentage of the fair market value that is determined by local assessors to be the total taxable value of land and additions on the property. | Land | Improvement |
|---|---|---|---|---|
| 2025 | $4,777 | $248,940 | -- | -- |
| 2024 | $4,520 | $241,690 | -- | -- |
| 2023 | $4,090 | $234,660 | $0 | $0 |
| 2022 | $3,989 | $227,830 | $0 | $0 |
| 2021 | $3,891 | $221,200 | $0 | $0 |
| 2020 | $3,640 | $214,760 | $0 | $0 |
| 2019 | $3,489 | $208,510 | $0 | $0 |
| 2018 | $3,454 | $202,440 | $0 | $0 |
| 2017 | $3,342 | $196,550 | $0 | $0 |
| 2016 | $3,197 | $190,830 | $0 | $0 |
Source: Public Records
Map
Nearby Homes
- 2516 SW 23rd St
- 3311 NE View Ave Unit 3313
- 2220 SW Brink Ave
- 2701 SW Latourell Place
- 24141 SE Oak St
- 2103 SW Stella Way
- 1431 SW 22nd St Unit 1433
- 2797 NE Rene Ave Unit 25C
- 2921 NE Rene Ave Unit 15B
- 2846 SW Faith Ct
- 1556 NE 27th Terrace
- 1548 SW Northstar Loop
- 1021 SW 24th St
- 24066 NE Treehill Dr Unit 12
- 24044 NE Treehill Dr Unit 6
- 24046 NE Treehill Dr Unit 7
- 2320 NE Rene Ave
- 3214 NE 29th St Unit 48
- 23882 NE Treehill Dr Unit T3882
- 3300 NE 29th St Unit 28
- 2192 NE 38th Dr
- 2144 NE 38th Dr
- 2120 NE 38th Dr
- 3765 NE Country Club Ave
- 2103 NE 36th Ct
- 2151 NE 38th Dr
- 2115 NE 36th Ct
- 3799 NE Country Club Ave
- 3731 NE Country Club Ave
- 2185 NE 38th Dr
- 2137 NE 38th Dr
- 2734 SW Country Club Ave
- 2086 NE 38th Dr
- 2086 NE 38 Dr
- 2047 NE 36th Ct
- 2760 SW Country Club Ave
- 3828 NE Francis Place
- 3845 NE Rene Ave
- 2102 NE 36th Ct
- 3830 NE Rene Ave
Your Personal Tour Guide
Ask me questions while you tour the home.