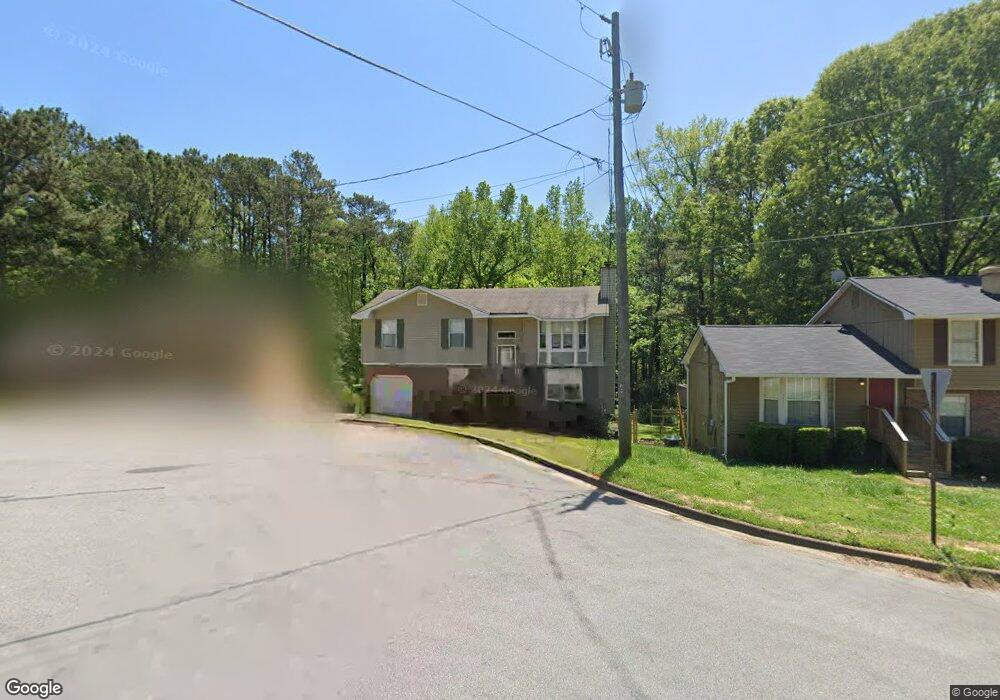
2178 Sara Ashley Way Lithonia, GA 30058
Estimated Value: $247,000 - $258,000
4
Beds
3
Baths
1,963
Sq Ft
$128/Sq Ft
Est. Value
About This Home
This home is located at 2178 Sara Ashley Way, Lithonia, GA 30058 and is currently estimated at $250,644, approximately $127 per square foot. 2178 Sara Ashley Way is a home located in DeKalb County with nearby schools including Panola Way Elementary School, Lithonia Middle School, and Lithonia High School.
Ownership History
Date
Name
Owned For
Owner Type
Purchase Details
Closed on
May 3, 2019
Sold by
Mupr 3 Assets Llc
Bought by
Srmz 3 Llc
Current Estimated Value
Purchase Details
Closed on
Apr 3, 2018
Sold by
Rasheed Candice W
Bought by
Mupr 3 Assets Llc
Purchase Details
Closed on
Mar 23, 2010
Sold by
Rasheed Candice W
Bought by
Rasheed Saeed I and Rasheed Candice W
Home Financials for this Owner
Home Financials are based on the most recent Mortgage that was taken out on this home.
Original Mortgage
$93,279
Interest Rate
5.37%
Mortgage Type
FHA
Purchase Details
Closed on
Jan 19, 2010
Sold by
Us Bank Na Tbw 2006-6
Bought by
Collins Mark
Purchase Details
Closed on
Mar 3, 2009
Sold by
Edgerton Bruce A and Edgerton Ronda A
Bought by
Us Bank Na 2006-6
Create a Home Valuation Report for This Property
The Home Valuation Report is an in-depth analysis detailing your home's value as well as a comparison with similar homes in the area
Home Values in the Area
Average Home Value in this Area
Purchase History
| Date | Buyer | Sale Price | Title Company |
|---|---|---|---|
| Srmz 3 Llc | $182,505 | -- | |
| Mupr 3 Assets Llc | $83,000 | -- | |
| Rasheed Saeed I | -- | -- | |
| Rasheed Candice W | $95,000 | -- | |
| Collins Mark | $32,000 | -- | |
| Us Bank Na 2006-6 | $61,574 | -- |
Source: Public Records
Mortgage History
| Date | Status | Borrower | Loan Amount |
|---|---|---|---|
| Previous Owner | Rasheed Candice W | $93,279 |
Source: Public Records
Tax History Compared to Growth
Tax History
| Year | Tax Paid | Tax Assessment Tax Assessment Total Assessment is a certain percentage of the fair market value that is determined by local assessors to be the total taxable value of land and additions on the property. | Land | Improvement |
|---|---|---|---|---|
| 2025 | $5,043 | $105,160 | $16,800 | $88,360 |
| 2024 | $5,041 | $105,160 | $16,800 | $88,360 |
| 2023 | $5,041 | $90,320 | $16,800 | $73,520 |
| 2022 | $2,663 | $53,000 | $6,480 | $46,520 |
| 2021 | $2,663 | $53,000 | $6,480 | $46,520 |
| 2020 | $2,389 | $55,000 | $6,480 | $48,520 |
| 2019 | $2,017 | $38,280 | $6,508 | $31,772 |
| 2018 | $1,063 | $38,280 | $6,480 | $31,800 |
| 2017 | $1,295 | $38,440 | $6,480 | $31,960 |
| 2016 | $1,169 | $35,680 | $6,480 | $29,200 |
| 2014 | $593 | $18,760 | $6,480 | $12,280 |
Source: Public Records
Map
Nearby Homes
- 2158 Sara Ashley Way
- 2202 Lowtrail Ct
- 2218 Lowtrail Ct
- 2138 Tiffany Trail
- 2169 Tiffany Ln
- 5876 Old Wellborn Trace
- 2128 Tiffany Ln
- 2063 Wellborn Close
- 5822 Cedar Croft Ln
- 2284 Cypress Point Way
- 6047 Marbut Rd
- 2030 Hilda Burns Place
- 5812 Wind Gate Ln
- 2285 Cherokee Valley Cir Unit III
- 2237 Wind Rose Ct
- 2089 Quilt Ct
- Pearson Plan at Wellington Park
- 2067 Raintree Place
- 5805 Marbut Rd
- 6082 Raintree Bend
- 2180 Sara Ashley Way
- 2176 Sara Ashley Way
- 2184 Sara Ashley Way
- 2204 Lowtrail Ct
- 2174 Sara Ashley Way
- 2208 Lowtrail Ct
- 2177 Tiffany Trail
- 2173 Tiffany Trail
- 2172 Sara Ashley Way
- 2188 Sara Ashley Way
- 2173 Sara Ashley Way
- 2212 Lowtrail Ct
- 2183 Sara Ashley Way
- 2171 Tiffany Trail
- 2201 Lowtrail Ct Unit 32
- 2201 Lowtrail Ct
- 2190 Sara Ashley Way
- 2189 Sara Ashley Way
- 2176 Tiffany Trail
- 2187 Sara Ashley Way