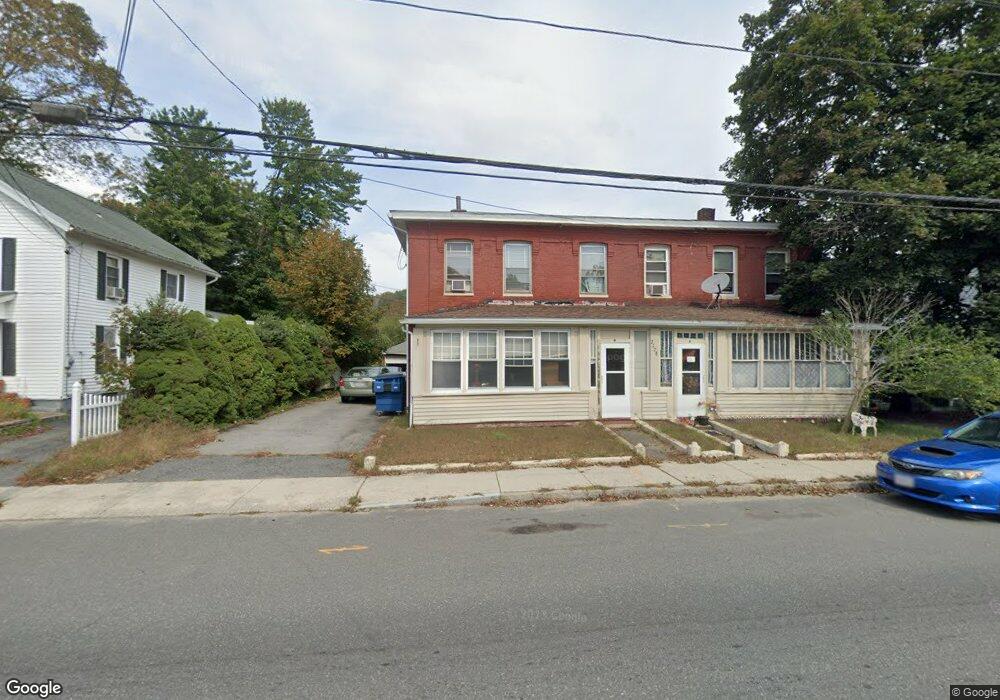
2178A Main St West Warren, MA 01092
Estimated Value: $160,000 - $227,000
3
Beds
1
Bath
1,650
Sq Ft
$125/Sq Ft
Est. Value
About This Home
This home is located at 2178A Main St, West Warren, MA 01092 and is currently estimated at $205,962, approximately $124 per square foot. 2178A Main St is a home with nearby schools including Quaboag Regional High School.
Ownership History
Date
Name
Owned For
Owner Type
Purchase Details
Closed on
Feb 27, 2003
Sold by
Starsiak Elizabeth and Rheaume Lucille M
Bought by
Rheaume Lucille M
Current Estimated Value
Home Financials for this Owner
Home Financials are based on the most recent Mortgage that was taken out on this home.
Original Mortgage
$40,000
Outstanding Balance
$17,015
Interest Rate
5.98%
Mortgage Type
Purchase Money Mortgage
Estimated Equity
$188,947
Create a Home Valuation Report for This Property
The Home Valuation Report is an in-depth analysis detailing your home's value as well as a comparison with similar homes in the area
Home Values in the Area
Average Home Value in this Area
Purchase History
| Date | Buyer | Sale Price | Title Company |
|---|---|---|---|
| Rheaume Lucille M | $40,000 | -- | |
| Rheaume Lucille M | $40,000 | -- |
Source: Public Records
Mortgage History
| Date | Status | Borrower | Loan Amount |
|---|---|---|---|
| Open | Rheaume Lucille M | $40,000 | |
| Closed | Rheaume Lucille M | $40,000 |
Source: Public Records
Tax History Compared to Growth
Tax History
| Year | Tax Paid | Tax Assessment Tax Assessment Total Assessment is a certain percentage of the fair market value that is determined by local assessors to be the total taxable value of land and additions on the property. | Land | Improvement |
|---|---|---|---|---|
| 2025 | $2,315 | $156,300 | $40,800 | $115,500 |
| 2024 | $2,355 | $156,300 | $40,800 | $115,500 |
| 2023 | $2,321 | $146,900 | $40,800 | $106,100 |
| 2022 | $2,034 | $130,700 | $35,200 | $95,500 |
| 2021 | $1,982 | $124,200 | $33,100 | $91,100 |
| 2020 | $2,008 | $117,000 | $33,100 | $83,900 |
| 2019 | $2,016 | $111,100 | $33,100 | $78,000 |
| 2018 | $1,864 | $107,600 | $33,100 | $74,500 |
| 2017 | $1,938 | $104,400 | $34,600 | $69,800 |
| 2016 | $1,974 | $99,500 | $32,800 | $66,700 |
| 2015 | $1,781 | $95,000 | $32,800 | $62,200 |
| 2014 | $1,815 | $95,000 | $32,800 | $62,200 |
Source: Public Records
Map
Nearby Homes
- 2178B Main St
- 2186 Main St
- 2172 Main St
- 2190 Main St
- 27 Santos Rd
- 2185 Main St
- 2162 Main St
- 2162 Main St Unit 2
- 2162 Main St Unit 1
- 2198 Main St
- 27 North St
- 41 North
- 2195 Main St Unit 1
- 2195 Main St
- 2195 Main St Unit A
- 2204 Main St
- 24-APT 1-6 North St
- 24 North St Unit 3A
- 24 North St Unit 3B
- 24 North St Unit 1B