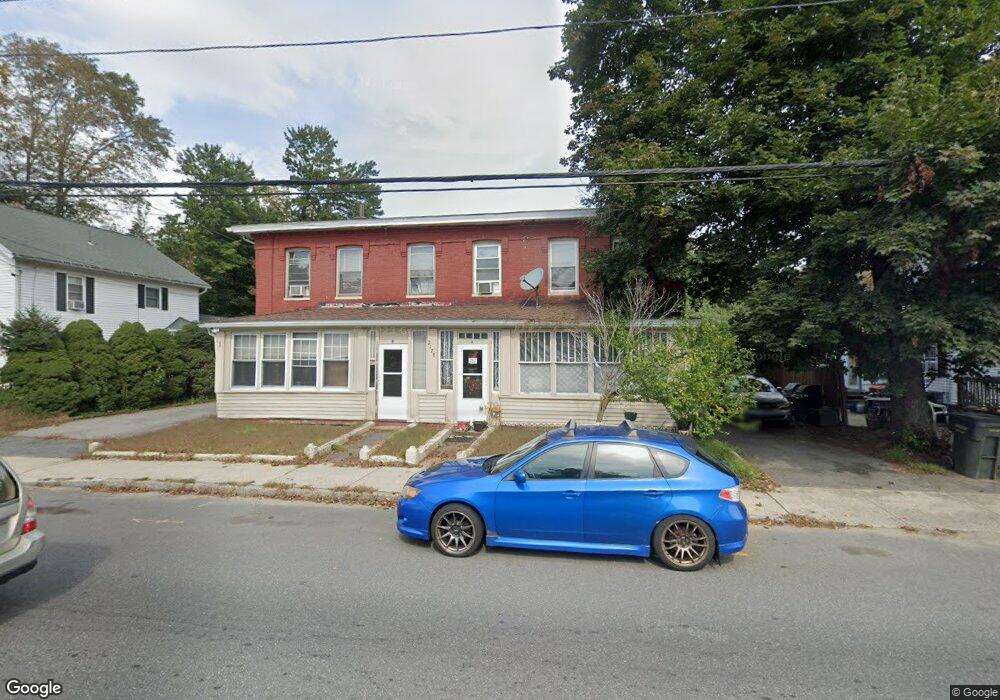
2178B Main St West Warren, MA 01092
Estimated Value: $231,518 - $375,000
3
Beds
1
Bath
1,650
Sq Ft
$180/Sq Ft
Est. Value
About This Home
This home is located at 2178B Main St, West Warren, MA 01092 and is currently estimated at $296,880, approximately $179 per square foot. 2178B Main St is a home with nearby schools including Quaboag Regional High School.
Ownership History
Date
Name
Owned For
Owner Type
Purchase Details
Closed on
Sep 30, 2005
Sold by
Starsiak Michael A
Bought by
Bond Michael and Thomas Paul
Current Estimated Value
Home Financials for this Owner
Home Financials are based on the most recent Mortgage that was taken out on this home.
Original Mortgage
$181,600
Outstanding Balance
$96,498
Interest Rate
5.84%
Mortgage Type
Purchase Money Mortgage
Estimated Equity
$200,382
Create a Home Valuation Report for This Property
The Home Valuation Report is an in-depth analysis detailing your home's value as well as a comparison with similar homes in the area
Home Values in the Area
Average Home Value in this Area
Purchase History
| Date | Buyer | Sale Price | Title Company |
|---|---|---|---|
| Bond Michael | $227,000 | -- | |
| Bond Michael | $227,000 | -- | |
| Bond Michael | $227,000 | -- |
Source: Public Records
Mortgage History
| Date | Status | Borrower | Loan Amount |
|---|---|---|---|
| Open | Bond Michael | $181,600 | |
| Closed | Bond Michael | $181,600 |
Source: Public Records
Tax History
| Year | Tax Paid | Tax Assessment Tax Assessment Total Assessment is a certain percentage of the fair market value that is determined by local assessors to be the total taxable value of land and additions on the property. | Land | Improvement |
|---|---|---|---|---|
| 2025 | $2,356 | $159,100 | $40,500 | $118,600 |
| 2024 | $2,398 | $159,100 | $40,500 | $118,600 |
| 2023 | $2,365 | $149,700 | $40,500 | $109,200 |
| 2022 | $2,077 | $133,500 | $34,900 | $98,600 |
| 2021 | $2,029 | $127,100 | $32,900 | $94,200 |
| 2020 | $2,057 | $119,900 | $32,900 | $87,000 |
| 2019 | $2,069 | $114,000 | $32,900 | $81,100 |
| 2018 | $1,914 | $110,500 | $32,900 | $77,600 |
| 2017 | $1,990 | $107,200 | $34,300 | $72,900 |
| 2016 | $2,032 | $102,400 | $32,600 | $69,800 |
| 2015 | $1,836 | $97,900 | $32,600 | $65,300 |
| 2014 | $1,870 | $97,900 | $32,600 | $65,300 |
Source: Public Records
Map
Nearby Homes
- 2240 Main St
- 77 O'Neil Rd
- 235 Crouch Rd
- Lot 3C Crouch Rd
- 378 Rondeau St
- 95 Town Farm Rd
- 0 Town Farm Rd
- Lot 7 Reed St
- 170 Bridge St
- Lot 5 Brimfield Rd
- Lot 3 Brimfield Rd
- 59 High St
- 233 Maple St
- Lot 2 Brimfield Rd
- Lot 1 Brimfield Rd
- 431 Coy Hill Rd
- 17 Otis St
- 111 Quaboag St
- Lot 4 Brimfield Rd
- 35 Bacon St
- 2178A Main St
- 2172 Main St
- 2186 Main St
- 2190 Main St
- 2162 Main St
- 2162 Main St Unit 2
- 2162 Main St Unit 1
- 2185 Main St
- 27 Santos Rd
- 41 North
- 27 North St
- 24-APT 1-6 North St
- 2198 Main St
- 2195 Main St Unit 1
- 2195 Main St
- 2195 Main St Unit A
- 12 North St
- 2204 Main St
- 24 North St Unit 3A
- 24 North St Unit 3B