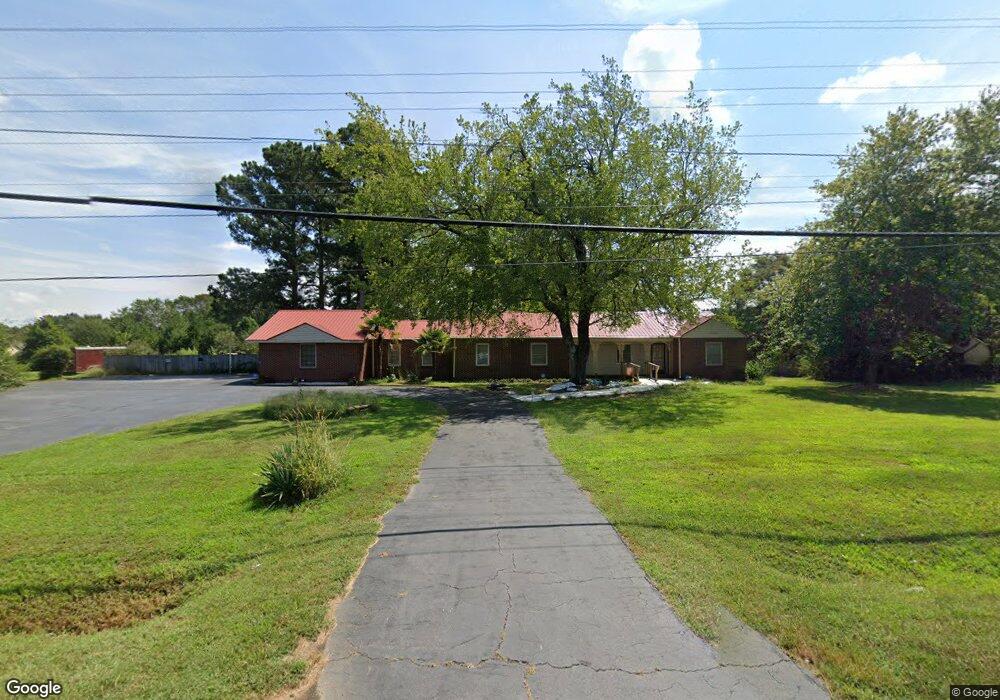
2179 Royston Hwy Hartwell, GA 30643
Estimated Value: $130,000 - $169,000
2
Beds
1
Bath
1,057
Sq Ft
$137/Sq Ft
Est. Value
About This Home
This home is located at 2179 Royston Hwy, Hartwell, GA 30643 and is currently estimated at $144,326, approximately $136 per square foot. 2179 Royston Hwy is a home located in Hart County with nearby schools including Hart County High School, Goldmine Christian Academy, and Hartwell Mennonite School.
Ownership History
Date
Name
Owned For
Owner Type
Purchase Details
Closed on
Jan 23, 2023
Sold by
Saucier Michael Welborn
Bought by
Crowe Austin Gregory
Current Estimated Value
Home Financials for this Owner
Home Financials are based on the most recent Mortgage that was taken out on this home.
Original Mortgage
$107,070
Outstanding Balance
$103,555
Interest Rate
6.27%
Mortgage Type
New Conventional
Estimated Equity
$40,771
Purchase Details
Closed on
Apr 23, 2021
Sold by
Herring Bruce
Bought by
Saucier Michael Welborn
Purchase Details
Closed on
Feb 24, 2021
Sold by
Lack Kaylie H
Bought by
Herring Bruce
Purchase Details
Closed on
Nov 20, 2020
Sold by
Scott Guynell
Bought by
Lack Kaylie H
Home Financials for this Owner
Home Financials are based on the most recent Mortgage that was taken out on this home.
Original Mortgage
$29,600
Interest Rate
2.8%
Mortgage Type
Commercial
Purchase Details
Closed on
Dec 1, 1990
Purchase Details
Closed on
Oct 1, 1964
Create a Home Valuation Report for This Property
The Home Valuation Report is an in-depth analysis detailing your home's value as well as a comparison with similar homes in the area
Home Values in the Area
Average Home Value in this Area
Purchase History
| Date | Buyer | Sale Price | Title Company |
|---|---|---|---|
| Crowe Austin Gregory | $104,360 | -- | |
| Saucier Michael Welborn | $52,900 | -- | |
| Herring Bruce | $42,000 | -- | |
| Lack Kaylie H | $37,000 | -- | |
| Carnes Wanda L | -- | -- | |
| -- | -- | -- | |
| -- | -- | -- |
Source: Public Records
Mortgage History
| Date | Status | Borrower | Loan Amount |
|---|---|---|---|
| Open | Crowe Austin Gregory | $107,070 | |
| Previous Owner | Carnes Wanda L | $29,600 |
Source: Public Records
Tax History Compared to Growth
Tax History
| Year | Tax Paid | Tax Assessment Tax Assessment Total Assessment is a certain percentage of the fair market value that is determined by local assessors to be the total taxable value of land and additions on the property. | Land | Improvement |
|---|---|---|---|---|
| 2024 | $909 | $37,636 | $10,000 | $27,636 |
| 2023 | $672 | $25,920 | $10,000 | $15,920 |
| 2022 | $325 | $19,527 | $5,600 | $13,927 |
| 2021 | $255 | $13,754 | $5,600 | $8,154 |
| 2020 | $264 | $13,655 | $5,600 | $8,055 |
| 2019 | $211 | $10,798 | $3,000 | $7,798 |
| 2018 | $223 | $11,269 | $3,000 | $8,269 |
| 2017 | $222 | $11,171 | $3,000 | $8,171 |
| 2016 | $235 | $11,479 | $3,000 | $8,479 |
| 2015 | $222 | $11,395 | $3,000 | $8,395 |
| 2014 | $227 | $11,412 | $3,000 | $8,412 |
| 2013 | -- | $12,425 | $3,000 | $9,425 |
Source: Public Records
Map
Nearby Homes
- 782 Sunset Rd
- 744 Cherokee Ridge Rd
- 835 Center of the World Rd
- 0 Bowman Hwy Unit 1021970
- 169 Brown St
- 0 Holly St Unit 10595836
- 560 Athens St
- 651 S Jackson St
- 72 Cade St
- 1021 Friendship Rd
- TRACT 6 Seed Cleaner Rd
- TRACT 5 Seed Cleaner Rd
- TRACT 4 Seed Cleaner Rd
- TRACT 3 Seed Cleaner Rd
- TRACT 2 Seed Cleaner Rd
- TRACT 1 Seed Cleaner Rd
- 130 Liberty Cir
- 1528 Hodges Mill Rd
- TRACT 4 Friendship Rd
- 183 Athens St
- 2179 Royston Hwy
- 2188 Royston Hwy
- 27 Fairway Ln
- 0 Fairway Ln Unit 8604193
- 0 Fairway Ln Unit 3102955
- 0 Fairway Ln
- 75 Fairway Ln
- 2081 Royston Hwy
- 2318 Royston Hwy
- 2071 Royston Hwy
- 2007 Royston Hwy
- 2020 Royston Hwy
- 220 Royston Hwy
- 2345 Royston Hwy
- 285 Golfview Dr
- 125 Fairway Ln Unit 4
- 125 Fairway Ln
- 60 Sunset Dr
- 350 Golfview Dr
- 1964 Royston Hwy