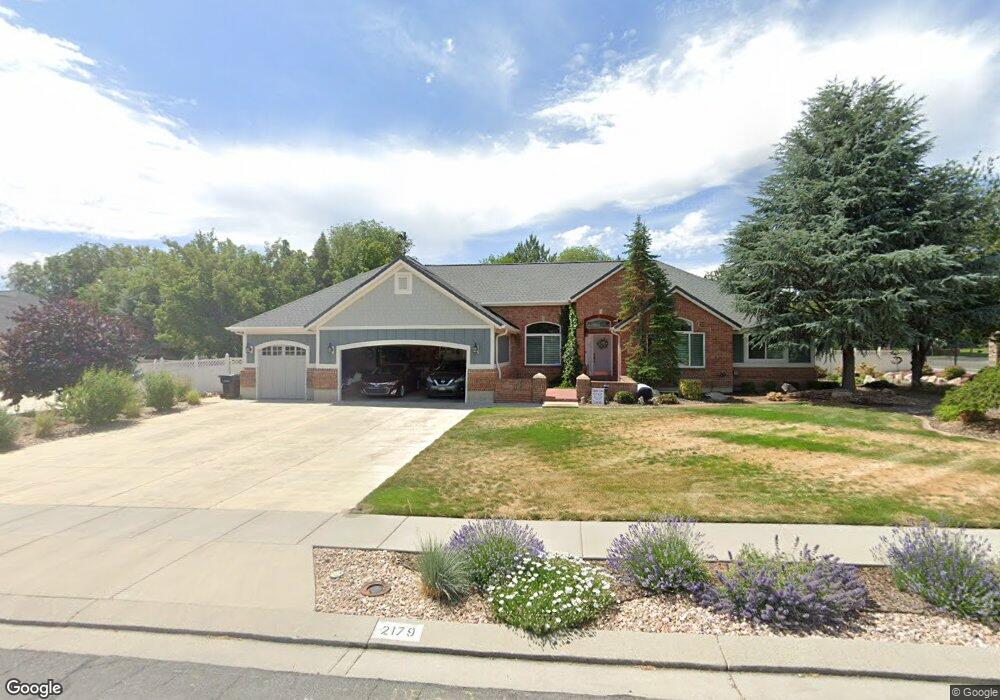
2179 W 9140 S West Jordan, UT 84088
Estimated Value: $952,000 - $1,040,000
5
Beds
4
Baths
4,744
Sq Ft
$210/Sq Ft
Est. Value
About This Home
This home is located at 2179 W 9140 S, West Jordan, UT 84088 and is currently estimated at $996,558, approximately $210 per square foot. 2179 W 9140 S is a home located in Salt Lake County with nearby schools including Westvale Elementary School, West Jordan Middle School, and West Jordan High School.
Ownership History
Date
Name
Owned For
Owner Type
Purchase Details
Closed on
Jul 3, 2018
Sold by
Ellis Richard K and Ellis Joyce P
Bought by
Ellis Richard K and Ellis Joyce P
Current Estimated Value
Purchase Details
Closed on
Jul 30, 2007
Sold by
Kimbell Lonnie J and Kimbell Linda
Bought by
Ellis Richard K and Ellis Joyce P
Home Financials for this Owner
Home Financials are based on the most recent Mortgage that was taken out on this home.
Original Mortgage
$225,000
Outstanding Balance
$142,968
Interest Rate
6.73%
Mortgage Type
New Conventional
Estimated Equity
$853,590
Purchase Details
Closed on
Oct 21, 1997
Sold by
Riverton City
Bought by
Salt Lake County
Purchase Details
Closed on
Apr 15, 1996
Sold by
Bach Development Company
Bought by
Kimball Lonnie J and Kimball Linda
Home Financials for this Owner
Home Financials are based on the most recent Mortgage that was taken out on this home.
Original Mortgage
$150,000
Interest Rate
7.41%
Create a Home Valuation Report for This Property
The Home Valuation Report is an in-depth analysis detailing your home's value as well as a comparison with similar homes in the area
Home Values in the Area
Average Home Value in this Area
Purchase History
| Date | Buyer | Sale Price | Title Company |
|---|---|---|---|
| Ellis Richard K | -- | None Available | |
| Ellis Richard K | -- | Bonneville Superior Title | |
| Salt Lake County | -- | -- | |
| Kimball Lonnie J | -- | -- |
Source: Public Records
Mortgage History
| Date | Status | Borrower | Loan Amount |
|---|---|---|---|
| Open | Ellis Richard K | $225,000 | |
| Previous Owner | Kimball Lonnie J | $150,000 |
Source: Public Records
Tax History Compared to Growth
Tax History
| Year | Tax Paid | Tax Assessment Tax Assessment Total Assessment is a certain percentage of the fair market value that is determined by local assessors to be the total taxable value of land and additions on the property. | Land | Improvement |
|---|---|---|---|---|
| 2025 | $4,657 | $944,600 | $312,500 | $632,100 |
| 2024 | $4,657 | $896,000 | $297,600 | $598,400 |
| 2023 | $4,286 | $777,100 | $275,600 | $501,500 |
| 2022 | $4,579 | $816,900 | $270,200 | $546,700 |
| 2021 | $4,132 | $671,000 | $216,100 | $454,900 |
| 2020 | $4,353 | $663,400 | $216,100 | $447,300 |
| 2019 | $4,331 | $647,200 | $216,100 | $431,100 |
| 2018 | $3,981 | $590,100 | $210,400 | $379,700 |
| 2017 | $3,783 | $558,300 | $210,400 | $347,900 |
| 2016 | $3,587 | $497,300 | $221,500 | $275,800 |
| 2015 | $3,454 | $466,900 | $221,500 | $245,400 |
| 2014 | $3,311 | $440,700 | $210,900 | $229,800 |
Source: Public Records
Map
Nearby Homes
- 2223 W Williamsburg Cir
- 2286 Williamsburg Cir
- 2177 W 9240 S
- 9252 S 2040 W Unit D
- 2116 W Abbey View Rd
- 1968 W 9270 S Unit C
- 2097 Jordan Villa Dr
- 9414 S 1980 W
- 8859 S Long Dr
- 9178 Lisa Ave
- 2041 W 8820 S
- 2636 W 9110 S
- 9496 S 1930 W
- 1753 Rylie Ann Cir
- 9294 S 2700 W
- 9511 S Tirado Cove Unit 204
- Brook Haven Plan at Jordan Woods
- Maple Plan at Jordan Woods
- The Maple Basement Plan at Jordan Woods
- The Evergreen Basement Plan at Jordan Woods
- 2153 W 9140 S
- 2224 Williamsburg Cir
- 2224 W Williamsburg Cir
- 9187 S 2200 W
- 2184 W 9140 S
- 2164 W 9140 S
- 2221 Williamsburg Cir
- 2127 W 9140 S
- 2223 Williamsburg Cir
- 2144 W 9140 S
- 2244 Williamsburg Cir
- 2126 W 9140 S
- 2243 W Williamsburg Cir
- 2243 Williamsburg Cir
- 2176 W 9240 S
- 2245 Williamsburg Cir
- 9210 S 2200 W
- 9095 S 2200 W
- 2109 W 9140 S
- 2222 Williamsburg Cir