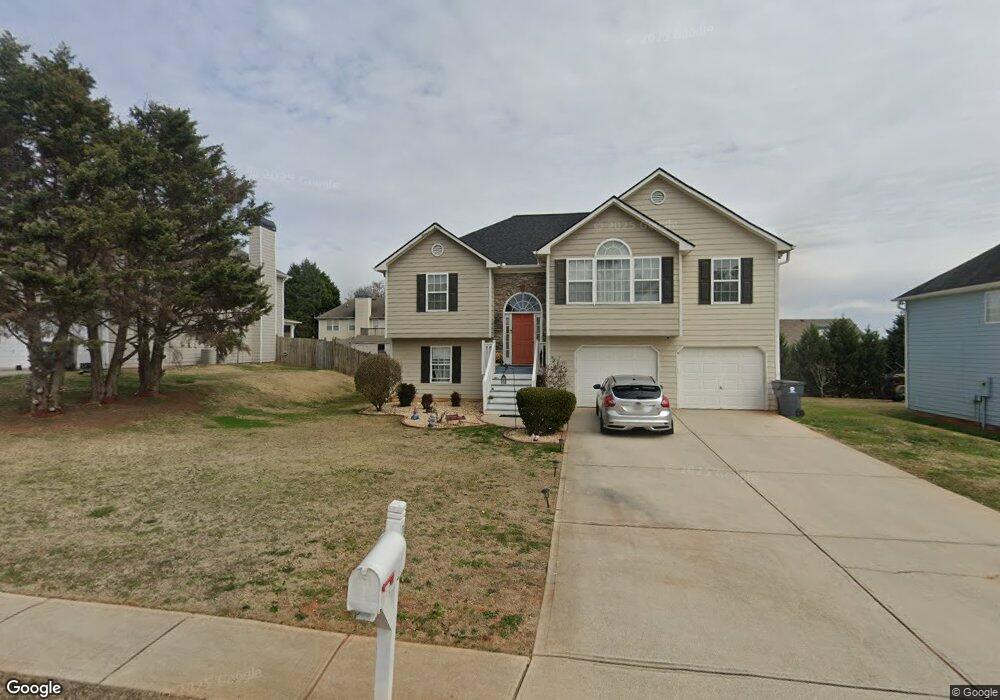
218 Acorn Hill Ct Unit 9 Villa Rica, GA 30180
Estimated Value: $322,000 - $339,000
5
Beds
3
Baths
2,540
Sq Ft
$130/Sq Ft
Est. Value
About This Home
This home is located at 218 Acorn Hill Ct Unit 9, Villa Rica, GA 30180 and is currently estimated at $329,902, approximately $129 per square foot. 218 Acorn Hill Ct Unit 9 is a home located in Carroll County with nearby schools including Ithica Elementary School, Bay Springs Middle School, and Villa Rica High School.
Ownership History
Date
Name
Owned For
Owner Type
Purchase Details
Closed on
Aug 31, 2015
Sold by
Carter Josh D
Bought by
Patel Sulochanaben S and Patel Sunilkumar A
Current Estimated Value
Home Financials for this Owner
Home Financials are based on the most recent Mortgage that was taken out on this home.
Original Mortgage
$112,800
Outstanding Balance
$88,928
Interest Rate
4.02%
Mortgage Type
New Conventional
Estimated Equity
$240,974
Purchase Details
Closed on
Jun 17, 2004
Sold by
Noble Builders Inc
Bought by
Carter Josh D and Carter Jennifer
Purchase Details
Closed on
Oct 17, 2003
Sold by
Vbc Properties Llc
Bought by
Belans Properties Inc
Purchase Details
Closed on
Aug 19, 2003
Bought by
Adh Development Inc
Purchase Details
Closed on
Jul 28, 2003
Sold by
Adh Dev
Bought by
Progressive Ent Unlimited
Create a Home Valuation Report for This Property
The Home Valuation Report is an in-depth analysis detailing your home's value as well as a comparison with similar homes in the area
Home Values in the Area
Average Home Value in this Area
Purchase History
| Date | Buyer | Sale Price | Title Company |
|---|---|---|---|
| Patel Sulochanaben S | $141,000 | -- | |
| Carter Josh D | $151,900 | -- | |
| Belans Properties Inc | $3,502,000 | -- | |
| Vbc Properties Llc | $2,987,000 | -- | |
| Noble Builders Inc | $1,836,000 | -- | |
| Adh Development Inc | -- | -- | |
| Progressive Ent Unlimited | -- | -- |
Source: Public Records
Mortgage History
| Date | Status | Borrower | Loan Amount |
|---|---|---|---|
| Open | Patel Sulochanaben S | $112,800 |
Source: Public Records
Tax History Compared to Growth
Tax History
| Year | Tax Paid | Tax Assessment Tax Assessment Total Assessment is a certain percentage of the fair market value that is determined by local assessors to be the total taxable value of land and additions on the property. | Land | Improvement |
|---|---|---|---|---|
| 2024 | $2,931 | $103,886 | $10,000 | $93,886 |
| 2023 | $2,931 | $110,710 | $10,000 | $100,710 |
| 2022 | $2,649 | $84,562 | $10,000 | $74,562 |
| 2021 | $2,354 | $73,831 | $10,000 | $63,831 |
| 2020 | $2,338 | $73,252 | $10,000 | $63,252 |
| 2019 | $2,152 | $68,050 | $10,000 | $58,050 |
| 2018 | $1,985 | $61,419 | $10,000 | $51,419 |
| 2017 | $1,874 | $57,306 | $10,000 | $47,306 |
| 2016 | $1,853 | $57,306 | $10,000 | $47,306 |
| 2015 | $1,475 | $42,800 | $10,000 | $32,801 |
| 2014 | $1,486 | $42,801 | $10,000 | $32,801 |
Source: Public Records
Map
Nearby Homes
- 371 Oakhaven Way
- 534 Great Oak Place
- The Maddux II Plan at Jameson Towns
- The Ellison II Plan at Jameson Towns
- The Norwood II Plan at Jameson Towns
- 737 Great Oak Place
- 738 Great Oak Place
- 742 Great Oak Place
- 818 Major Oak Ct Unit 64
- 818 Major Oak Ct
- 745 Great Oak Place
- 746 Great Oak Place
- 735 Great Oak Place Unit 74
- Tucker FP Plan at Twin Oaks
- Mira Plan at Twin Oaks
- Jodeco FP Plan at Twin Oaks
- 645 Amberwood Dr
- 0 NE Hickory Level Rd Unit 132 143664
- 768 Great Oak Place
- 768 Great Oak Place Unit 26
- 218 Acorn Hill Ct
- 206 Acorn Hill Ct
- 224 Acorn Hill Ct
- 311 Oakhaven Way
- 305 Oakhaven Way
- 317 Oakhaven Way
- 201 Acorn Hill Ct
- 230 Acorn Hill Ct
- 301 Oakhaven Way
- 323 Oakhaven Way
- 211 Acorn Hill Ct
- 217 Acorn Hill Ct
- 236 Acorn Hill Ct
- 0 Acorn Hill Ct Unit 7476214
- 0 Acorn Hill Ct Unit 8402791
- 0 Acorn Hill Ct Unit 7561462
- 0 Acorn Hill Ct Unit 7353985
- 0 Acorn Hill Ct
- 235 Acorn Hill Ct
- 223 Acorn Hill Ct