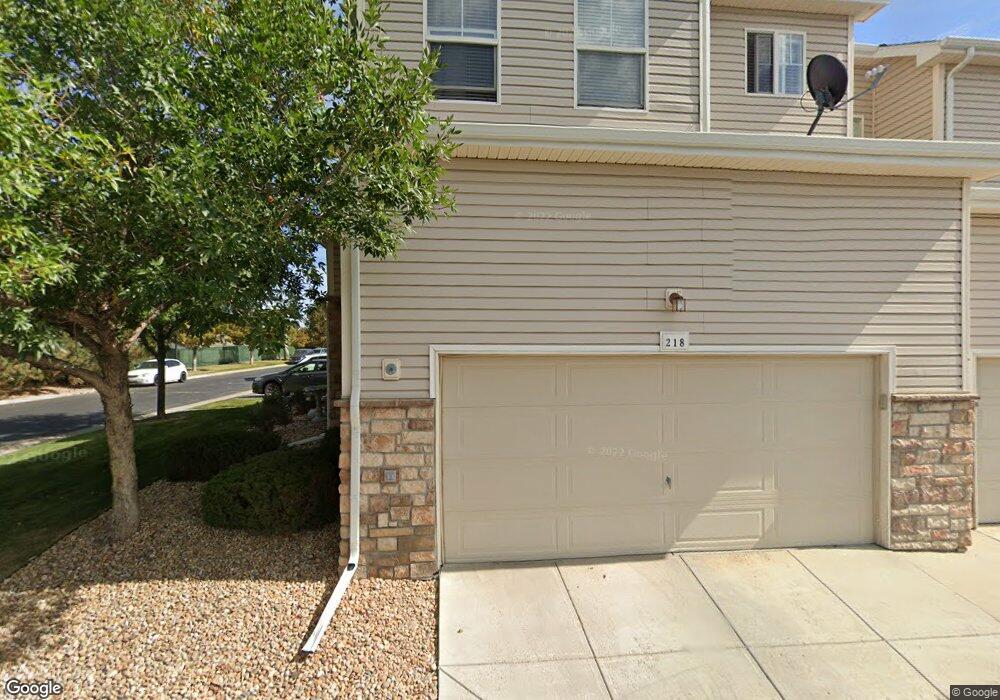
218 Alyssum Dr Unit 13A Brighton, CO 80601
Estimated Value: $354,000 - $395,000
3
Beds
3
Baths
1,568
Sq Ft
$237/Sq Ft
Est. Value
About This Home
This home is located at 218 Alyssum Dr Unit 13A, Brighton, CO 80601 and is currently estimated at $371,885, approximately $237 per square foot. 218 Alyssum Dr Unit 13A is a home located in Adams County with nearby schools including Overland Trail Middle School, Brighton High School, and Bromley East Charter School.
Ownership History
Date
Name
Owned For
Owner Type
Purchase Details
Closed on
Jun 14, 2016
Sold by
Rowe Jeremiah
Bought by
Rowe Elizabeth
Current Estimated Value
Purchase Details
Closed on
Jun 30, 2015
Sold by
Rowe Jeremiah and Chin Chim Yong
Bought by
Rowe Jeremiah and Chin Chim Yong
Purchase Details
Closed on
Dec 19, 2006
Sold by
Miller Joseph C and Miller Sharon K
Bought by
Cain Karen L
Home Financials for this Owner
Home Financials are based on the most recent Mortgage that was taken out on this home.
Original Mortgage
$131,200
Interest Rate
6.2%
Mortgage Type
Unknown
Purchase Details
Closed on
Nov 28, 2005
Sold by
Pulte Home Corp
Bought by
Miller Joseph C and Miller Sharon K
Home Financials for this Owner
Home Financials are based on the most recent Mortgage that was taken out on this home.
Original Mortgage
$156,456
Interest Rate
6.06%
Mortgage Type
FHA
Create a Home Valuation Report for This Property
The Home Valuation Report is an in-depth analysis detailing your home's value as well as a comparison with similar homes in the area
Home Values in the Area
Average Home Value in this Area
Purchase History
| Date | Buyer | Sale Price | Title Company |
|---|---|---|---|
| Rowe Elizabeth | -- | None Available | |
| Rowe Jeremiah | -- | None Available | |
| Rowe Jeremiah | -- | None Available | |
| Rowe Jeremiah | $202,500 | Fidelity National Title | |
| Cain Karen L | $164,000 | Security Title | |
| Miller Joseph C | $161,295 | Land Title |
Source: Public Records
Mortgage History
| Date | Status | Borrower | Loan Amount |
|---|---|---|---|
| Previous Owner | Cain Karen L | $131,200 | |
| Previous Owner | Miller Joseph C | $156,456 |
Source: Public Records
Tax History Compared to Growth
Tax History
| Year | Tax Paid | Tax Assessment Tax Assessment Total Assessment is a certain percentage of the fair market value that is determined by local assessors to be the total taxable value of land and additions on the property. | Land | Improvement |
|---|---|---|---|---|
| 2024 | $4,119 | $23,130 | $4,690 | $18,440 |
| 2023 | $3,976 | $26,450 | $4,060 | $22,390 |
| 2022 | $3,349 | $19,830 | $3,610 | $16,220 |
| 2021 | $3,277 | $19,830 | $3,610 | $16,220 |
| 2020 | $3,249 | $19,740 | $3,720 | $16,020 |
| 2019 | $3,749 | $19,740 | $3,720 | $16,020 |
| 2018 | $3,138 | $16,830 | $830 | $16,000 |
| 2017 | $3,140 | $16,830 | $830 | $16,000 |
| 2016 | $2,455 | $13,120 | $920 | $12,200 |
| 2015 | $2,446 | $13,120 | $920 | $12,200 |
| 2014 | -- | $8,770 | $920 | $7,850 |
Source: Public Records
Map
Nearby Homes
- 215 Blue Bonnet Dr Unit 9C
- 214 Blue Bonnet Dr Unit C
- 118 Foxglove Dr Unit 23D
- 3978 Balderas St
- 156 Chapel Hill Cir
- 147 Chapel Hill Cir
- 3938 Balderas St
- 4250 Combine Place
- 207 Harrow Ct
- 256 Homestead Way
- 4436 Windmill Dr
- 445 Tumbleweed Dr
- Artisan Three Plan at Brighton Crossings - Artisan Portfolio
- Artisan Four Plan at Brighton Crossings - Artisan Portfolio
- Artisan One Plan at Brighton Crossings - Artisan Portfolio
- Artisan Two Plan at Brighton Crossings - Artisan Portfolio
- 258 N 45th Ave
- 229 Wooten Ave
- 217 Wooten Ave
- 267 Wooten Ave
- 218 Alyssum Private Dr
- 216 Alyssum Dr Unit 13B
- 216 Alyssum Dr
- 214 Alyssum Dr Unit 13C
- 212 Alyssum Dr Unit 13D
- 212 Alyssum Dr
- 249 Blue Bonnet Dr Unit 8A
- 210 Alyssum Dr
- 247 Blue Bonnet Dr Unit 8B
- 245 Blue Bonnet Dr Unit 8C
- 243 Blue Bonnet Dr Unit 8D
- 208 Alyssum Dr Unit 14A
- 241 Blue Bonnet Dr Unit 8E
- 219 Blue Bonnet Dr Unit 9A
- 206 Alyssum Dr Unit 14B
- 217 Blue Bonnet Dr Unit B
- 217 Blue Bonnet Dr Unit 9B
- 204 Alyssum Dr Unit 14C
- 204 Alyssum Private Dr
- 213 Blue Bonnet Dr Unit 9D