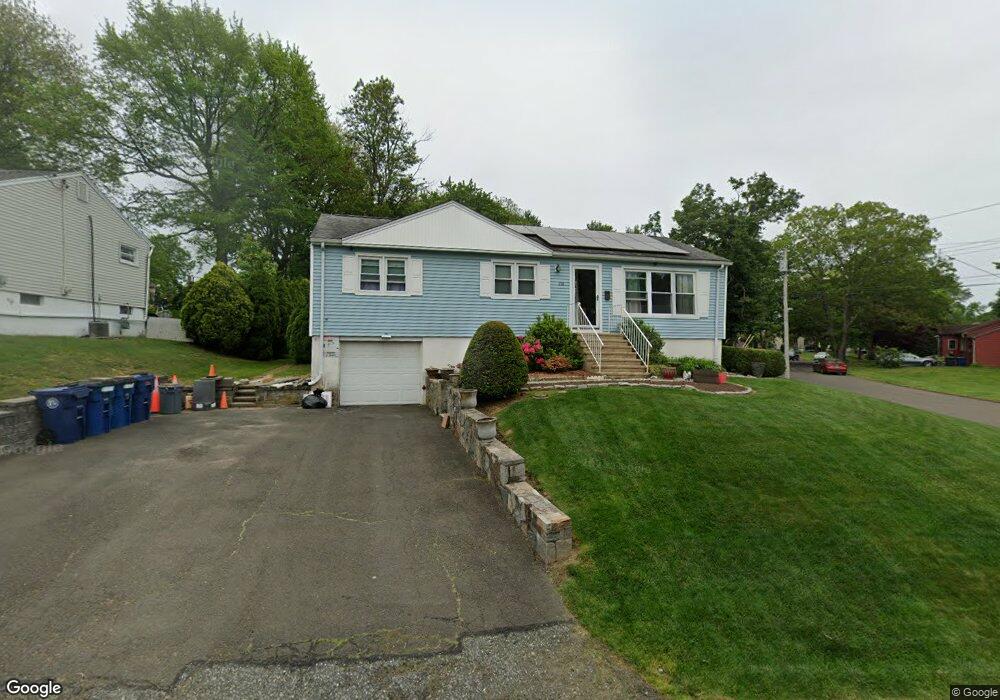
218 Beatrice Dr West Haven, CT 06516
West Shore NeighborhoodEstimated Value: $353,000 - $418,000
3
Beds
1
Bath
1,080
Sq Ft
$347/Sq Ft
Est. Value
About This Home
This home is located at 218 Beatrice Dr, West Haven, CT 06516 and is currently estimated at $374,815, approximately $347 per square foot. 218 Beatrice Dr is a home located in New Haven County with nearby schools including Carrigan 5/6 Intermediate School, Harry M. Bailey Middle School, and West Haven High School.
Ownership History
Date
Name
Owned For
Owner Type
Purchase Details
Closed on
Mar 5, 2021
Sold by
Johnson Stanley L
Bought by
Johnson Stanley L and Johnson Kathy
Current Estimated Value
Purchase Details
Closed on
Oct 26, 1990
Sold by
Swain Keith M
Bought by
Johnson Stanley L
Home Financials for this Owner
Home Financials are based on the most recent Mortgage that was taken out on this home.
Original Mortgage
$129,620
Interest Rate
10.08%
Mortgage Type
Purchase Money Mortgage
Create a Home Valuation Report for This Property
The Home Valuation Report is an in-depth analysis detailing your home's value as well as a comparison with similar homes in the area
Home Values in the Area
Average Home Value in this Area
Purchase History
| Date | Buyer | Sale Price | Title Company |
|---|---|---|---|
| Johnson Stanley L | -- | None Available | |
| Johnson Stanley L | -- | None Available | |
| Johnson Stanley L | $132,000 | -- |
Source: Public Records
Mortgage History
| Date | Status | Borrower | Loan Amount |
|---|---|---|---|
| Previous Owner | Johnson Stanley L | $168,100 | |
| Previous Owner | Johnson Stanley L | $20,000 | |
| Previous Owner | Johnson Stanley L | $128,917 | |
| Previous Owner | Johnson Stanley L | $129,620 |
Source: Public Records
Tax History Compared to Growth
Tax History
| Year | Tax Paid | Tax Assessment Tax Assessment Total Assessment is a certain percentage of the fair market value that is determined by local assessors to be the total taxable value of land and additions on the property. | Land | Improvement |
|---|---|---|---|---|
| 2025 | $7,236 | $220,150 | $84,700 | $135,450 |
| 2024 | $6,498 | $138,670 | $58,660 | $80,010 |
| 2023 | $6,254 | $138,670 | $58,660 | $80,010 |
| 2022 | $6,142 | $138,670 | $58,660 | $80,010 |
| 2021 | $6,142 | $138,670 | $58,660 | $80,010 |
| 2020 | $5,992 | $123,270 | $53,830 | $69,440 |
| 2019 | $5,801 | $123,270 | $53,830 | $69,440 |
| 2018 | $5,718 | $123,270 | $53,830 | $69,440 |
| 2017 | $5,564 | $123,270 | $53,830 | $69,440 |
| 2016 | $5,503 | $123,270 | $53,830 | $69,440 |
| 2015 | $5,343 | $133,980 | $58,380 | $75,600 |
| 2014 | $5,343 | $133,980 | $58,380 | $75,600 |
Source: Public Records
Map
Nearby Homes