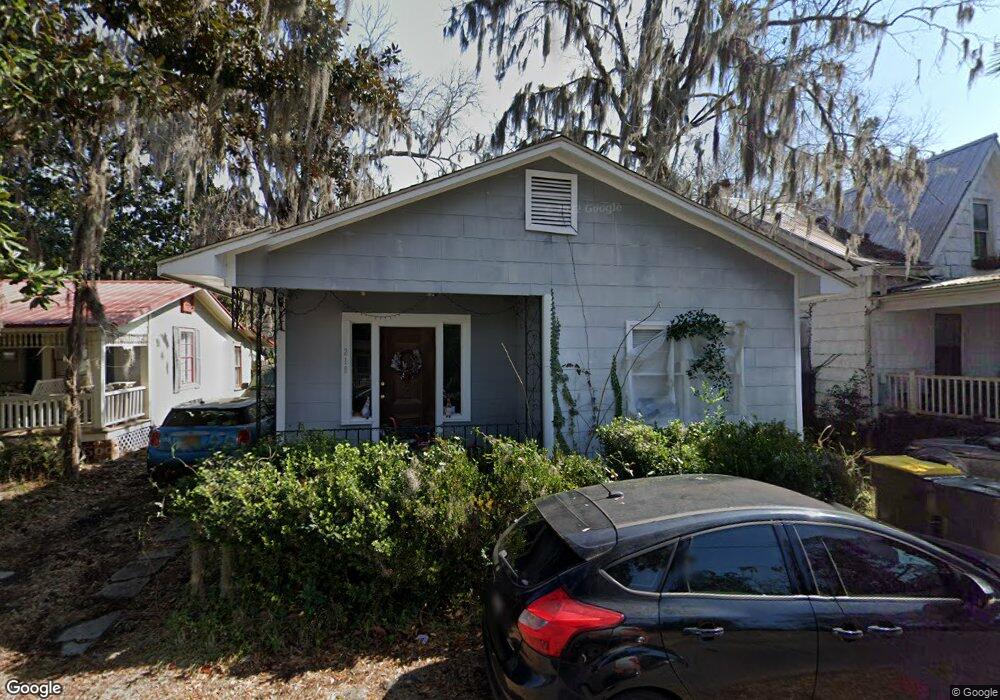
218 Bonaventure Rd Unit A Thunderbolt, GA 31404
Estimated Value: $203,894 - $355,000
2
Beds
2
Baths
1,040
Sq Ft
$262/Sq Ft
Est. Value
About This Home
This home is located at 218 Bonaventure Rd Unit A, Thunderbolt, GA 31404 and is currently estimated at $272,224, approximately $261 per square foot. 218 Bonaventure Rd Unit A is a home located in Chatham County with nearby schools including Shuman Elementary School, Hubert Middle School, and Johnson High School.
Ownership History
Date
Name
Owned For
Owner Type
Purchase Details
Closed on
Oct 23, 2014
Sold by
The Bank Of New York Mellon Tr
Bought by
Savage Ivor
Current Estimated Value
Home Financials for this Owner
Home Financials are based on the most recent Mortgage that was taken out on this home.
Original Mortgage
$60,800
Outstanding Balance
$46,350
Interest Rate
4.26%
Mortgage Type
New Conventional
Estimated Equity
$225,874
Purchase Details
Closed on
Jan 7, 2014
Sold by
Masey Craig C
Bought by
The Bank Of New York Mellon Tr and C/O Suntrust Mtg Inc
Purchase Details
Closed on
Feb 28, 2006
Sold by
Not Provided
Bought by
Massey Craig C
Home Financials for this Owner
Home Financials are based on the most recent Mortgage that was taken out on this home.
Original Mortgage
$97,600
Interest Rate
6.19%
Mortgage Type
New Conventional
Create a Home Valuation Report for This Property
The Home Valuation Report is an in-depth analysis detailing your home's value as well as a comparison with similar homes in the area
Home Values in the Area
Average Home Value in this Area
Purchase History
| Date | Buyer | Sale Price | Title Company |
|---|---|---|---|
| Savage Ivor | $67,179 | -- | |
| The Bank Of New York Mellon Tr | -- | -- | |
| Massey Craig C | $122,000 | -- |
Source: Public Records
Mortgage History
| Date | Status | Borrower | Loan Amount |
|---|---|---|---|
| Open | Savage Ivor | $60,800 | |
| Previous Owner | Massey Craig C | $97,600 | |
| Previous Owner | Massey Craig C | $24,400 |
Source: Public Records
Tax History
| Year | Tax Paid | Tax Assessment Tax Assessment Total Assessment is a certain percentage of the fair market value that is determined by local assessors to be the total taxable value of land and additions on the property. | Land | Improvement |
|---|---|---|---|---|
| 2025 | $3,383 | $67,320 | $4,000 | $63,320 |
| 2024 | $17 | $75,960 | $12,000 | $63,960 |
| 2023 | $1,688 | $49,640 | $5,400 | $44,240 |
| 2022 | $1,098 | $45,280 | $5,400 | $39,880 |
| 2021 | $1,085 | $37,000 | $5,400 | $31,600 |
| 2020 | $1,125 | $36,960 | $5,400 | $31,560 |
| 2019 | $1,124 | $36,960 | $5,400 | $31,560 |
| 2018 | $1,100 | $36,160 | $5,400 | $30,760 |
| 2017 | $1,026 | $36,400 | $5,400 | $31,000 |
| 2016 | $948 | $33,640 | $3,840 | $29,800 |
| 2015 | $758 | $26,872 | $3,144 | $23,728 |
| 2014 | $1,288 | $31,080 | $0 | $0 |
Source: Public Records
Map
Nearby Homes
- 217 Bonaventure Rd
- 2610 Dogwood Ave
- 2438 E 39th St
- 0 Furber Ave Unit 328119
- 2408 E 37th St Unit B
- 2408 E 37th St Unit C
- 2408 E 37th St Unit A
- 2220 E Victory Dr Unit 6
- 2702 River Dr
- 2716 Mechanics Ave
- 2322 Bonaventure Rd
- 2305 E 40th St
- 2140 E 42nd St
- 2224 E 38th St
- 2812 River Dr Unit 106
- 2411 Alabama Ave
- 2202 E 39th St
- 2511 Florida Ave
- 1801 E Henry St
- 2405 New York Ave
- 218A Bonaventure Rd
- 218 Bonaventure Rd
- 218 Bonaventure Rd
- 222 Bonaventure Rd
- 220 Bonaventure Rd
- 216 Bonaventure Rd
- 216 Bonaventure Rd
- 216 Bonaventure Rd
- 214 Bonaventure Rd Unit A
- 214 Bonaventure Rd
- 214 Bonaventure Rd
- 224 Bonaventure Rd
- Bonaventure Bonaventure Rd
- 212 Bonaventure Rd
- 302 Bonaventure Rd
- 304 Bonaventure Rd
- 208 Bonaventure Rd
- 345 Laurel Oak Ln
- 344 Laurel Oak Ln
- 303 Bonaventure Rd
Your Personal Tour Guide
Ask me questions while you tour the home.