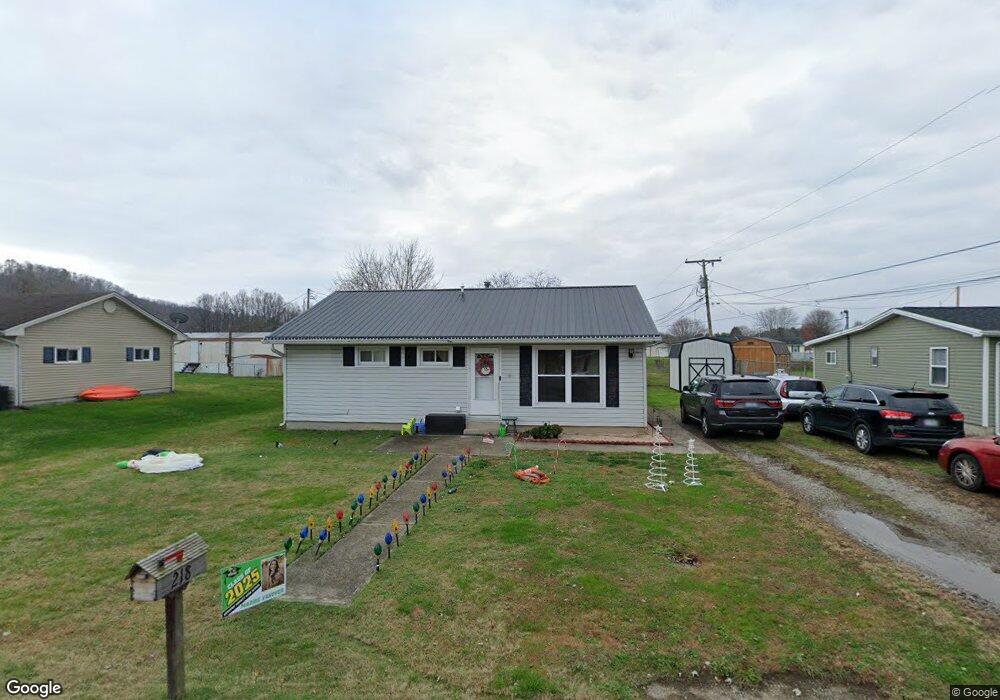
218 Bradford St South Shore, KY 41175
Estimated Value: $97,000 - $110,108
--
Bed
--
Bath
--
Sq Ft
7,623
Sq Ft Lot
About This Home
This home is located at 218 Bradford St, South Shore, KY 41175 and is currently estimated at $102,527. 218 Bradford St is a home located in Greenup County with nearby schools including Greenup County High School.
Ownership History
Date
Name
Owned For
Owner Type
Purchase Details
Closed on
Jun 30, 2014
Sold by
Kevin B Kevin B and Stith Michelle L
Bought by
Vanover Paul R and Vanover Melisa D
Current Estimated Value
Home Financials for this Owner
Home Financials are based on the most recent Mortgage that was taken out on this home.
Original Mortgage
$63,265
Outstanding Balance
$48,066
Interest Rate
4.17%
Mortgage Type
Purchase Money Mortgage
Estimated Equity
$54,461
Create a Home Valuation Report for This Property
The Home Valuation Report is an in-depth analysis detailing your home's value as well as a comparison with similar homes in the area
Home Values in the Area
Average Home Value in this Area
Purchase History
| Date | Buyer | Sale Price | Title Company |
|---|---|---|---|
| Vanover Paul R | $62,000 | -- |
Source: Public Records
Mortgage History
| Date | Status | Borrower | Loan Amount |
|---|---|---|---|
| Open | Vanover Paul R | $63,265 |
Source: Public Records
Tax History Compared to Growth
Tax History
| Year | Tax Paid | Tax Assessment Tax Assessment Total Assessment is a certain percentage of the fair market value that is determined by local assessors to be the total taxable value of land and additions on the property. | Land | Improvement |
|---|---|---|---|---|
| 2025 | $1,056 | $62,000 | $10,000 | $52,000 |
| 2024 | $1,055 | $62,000 | $10,000 | $52,000 |
| 2023 | $995 | $62,000 | $10,000 | $52,000 |
| 2022 | $965 | $62,000 | $10,000 | $52,000 |
| 2021 | $960 | $62,000 | $10,000 | $52,000 |
| 2020 | $945 | $62,000 | $10,000 | $52,000 |
| 2019 | $954 | $62,000 | $10,000 | $52,000 |
| 2018 | $977 | $62,000 | $10,000 | $52,000 |
| 2017 | $940 | $62,000 | $10,000 | $52,000 |
| 2016 | $940 | $62,000 | $10,000 | $52,000 |
| 2015 | $873 | $58,000 | $10,000 | $48,000 |
| 2014 | $865 | $58,000 | $10,000 | $48,000 |
| 2011 | -- | $58,000 | $10,000 | $48,000 |
Source: Public Records
Map
Nearby Homes