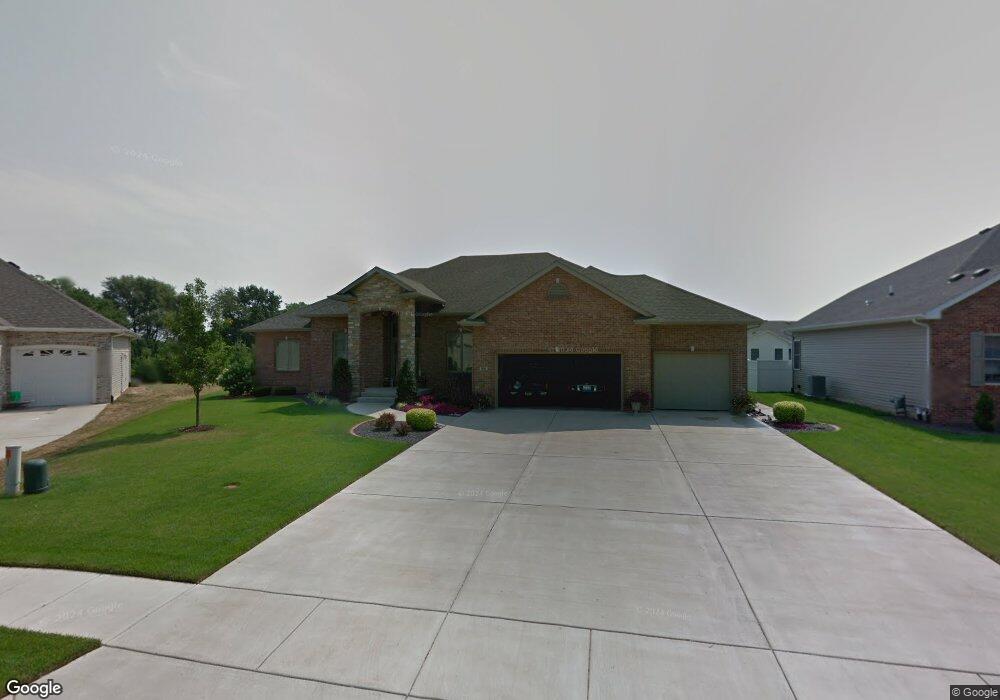
218 Buffett Dr Springfield, IL 62711
Estimated Value: $420,264 - $497,000
Studio
--
Bath
--
Sq Ft
12,632
Sq Ft Lot
About This Home
This home is located at 218 Buffett Dr, Springfield, IL 62711 and is currently estimated at $465,816. 218 Buffett Dr is a home located in Sangamon County with nearby schools including Farmingdale Elementary School, Pleasant Plains Middle School, and Pleasant Plains High School.
Ownership History
Date
Name
Owned For
Owner Type
Purchase Details
Closed on
Apr 8, 2021
Sold by
Lulajean Bausch 1999 Trust
Bought by
Zoerner Dustin and Lawhorn Kristin
Current Estimated Value
Home Financials for this Owner
Home Financials are based on the most recent Mortgage that was taken out on this home.
Original Mortgage
$346,750
Outstanding Balance
$312,568
Interest Rate
2.9%
Mortgage Type
New Conventional
Estimated Equity
$153,248
Purchase Details
Closed on
Mar 16, 2018
Sold by
Lulajean Bausch
Bought by
Lulajean Bausch 1999 Trust
Purchase Details
Closed on
Apr 24, 2007
Purchase Details
Closed on
Mar 13, 2007
Create a Home Valuation Report for This Property
The Home Valuation Report is an in-depth analysis detailing your home's value as well as a comparison with similar homes in the area
Purchase History
| Date | Buyer | Sale Price | Title Company |
|---|---|---|---|
| Zoerner Dustin | $365,000 | Cornerstone Title | |
| Lulajean Bausch 1999 Trust | -- | -- | |
| -- | $41,000 | -- | |
| -- | -- | -- |
Source: Public Records
Mortgage History
| Date | Status | Borrower | Loan Amount |
|---|---|---|---|
| Open | Zoerner Dustin | $346,750 |
Source: Public Records
Tax History
| Year | Tax Paid | Tax Assessment Tax Assessment Total Assessment is a certain percentage of the fair market value that is determined by local assessors to be the total taxable value of land and additions on the property. | Land | Improvement |
|---|---|---|---|---|
| 2024 | $10,761 | $140,178 | $22,781 | $117,397 |
| 2023 | $10,373 | $129,915 | $21,113 | $108,802 |
| 2022 | $9,889 | $121,189 | $19,695 | $101,494 |
| 2021 | $9,647 | $116,003 | $18,852 | $97,151 |
| 2020 | $9,883 | $113,695 | $18,477 | $95,218 |
| 2019 | $9,751 | $113,085 | $18,378 | $94,707 |
| 2018 | $8,762 | $114,066 | $18,537 | $95,529 |
| 2017 | $8,545 | $112,060 | $18,211 | $93,849 |
| 2016 | $8,280 | $108,312 | $17,602 | $90,710 |
| 2015 | $8,478 | $104,146 | $16,925 | $87,221 |
| 2014 | $8,354 | $102,729 | $16,695 | $86,034 |
| 2013 | $8,356 | $103,453 | $16,813 | $86,640 |
Source: Public Records
Map
Nearby Homes
Your Personal Tour Guide
Ask me questions while you tour the home.