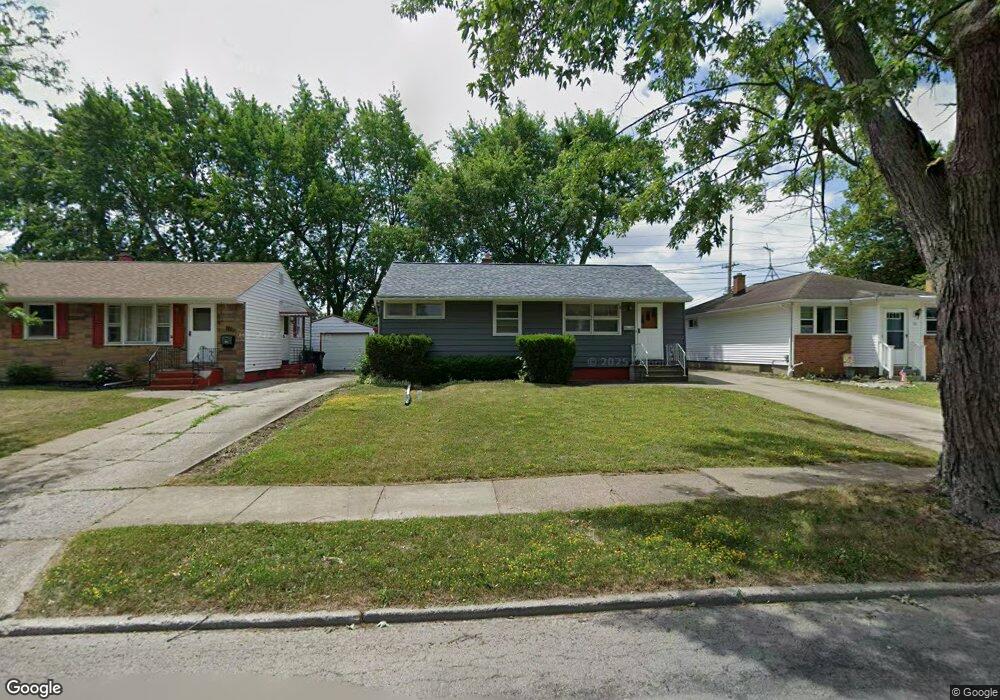
218 Canton St Tonawanda, NY 14150
Estimated Value: $171,000 - $197,000
3
Beds
1
Bath
905
Sq Ft
$206/Sq Ft
Est. Value
About This Home
This home is located at 218 Canton St, Tonawanda, NY 14150 and is currently estimated at $185,984, approximately $205 per square foot. 218 Canton St is a home located in Erie County with nearby schools including Mullen Elementary School, Tonawanda Elementary School, and Tonawanda Middle High School.
Ownership History
Date
Name
Owned For
Owner Type
Purchase Details
Closed on
Nov 15, 2011
Sold by
Darveaux Terry A and Darveaux Denis A
Bought by
Ortiz Mathew
Current Estimated Value
Home Financials for this Owner
Home Financials are based on the most recent Mortgage that was taken out on this home.
Original Mortgage
$64,326
Outstanding Balance
$43,545
Interest Rate
3.87%
Mortgage Type
FHA
Estimated Equity
$142,439
Purchase Details
Closed on
Oct 1, 2008
Sold by
Darveaux Mona I
Bought by
Darveaux Terry A and Darveaux Denis
Create a Home Valuation Report for This Property
The Home Valuation Report is an in-depth analysis detailing your home's value as well as a comparison with similar homes in the area
Home Values in the Area
Average Home Value in this Area
Purchase History
| Date | Buyer | Sale Price | Title Company |
|---|---|---|---|
| Ortiz Mathew | $66,000 | None Available | |
| Darveaux Terry A | -- | None Available |
Source: Public Records
Mortgage History
| Date | Status | Borrower | Loan Amount |
|---|---|---|---|
| Open | Ortiz Mathew | $64,326 |
Source: Public Records
Tax History Compared to Growth
Tax History
| Year | Tax Paid | Tax Assessment Tax Assessment Total Assessment is a certain percentage of the fair market value that is determined by local assessors to be the total taxable value of land and additions on the property. | Land | Improvement |
|---|---|---|---|---|
| 2024 | $1,919 | $127,000 | $14,400 | $112,600 |
| 2023 | $1,430 | $127,000 | $14,400 | $112,600 |
| 2022 | $1,779 | $80,000 | $15,500 | $64,500 |
| 2021 | $1,772 | $80,000 | $15,500 | $64,500 |
| 2020 | $1,287 | $80,000 | $15,500 | $64,500 |
| 2019 | $2,168 | $80,000 | $15,500 | $64,500 |
| 2018 | $1,223 | $80,000 | $15,500 | $64,500 |
| 2017 | $400 | $66,000 | $15,200 | $50,800 |
| 2016 | $1,028 | $66,000 | $15,200 | $50,800 |
| 2015 | -- | $66,000 | $15,200 | $50,800 |
| 2014 | -- | $66,000 | $15,200 | $50,800 |
Source: Public Records
Map
Nearby Homes