Estimated Value: $153,000 - $189,809
2
Beds
1
Bath
908
Sq Ft
$191/Sq Ft
Est. Value
About This Home
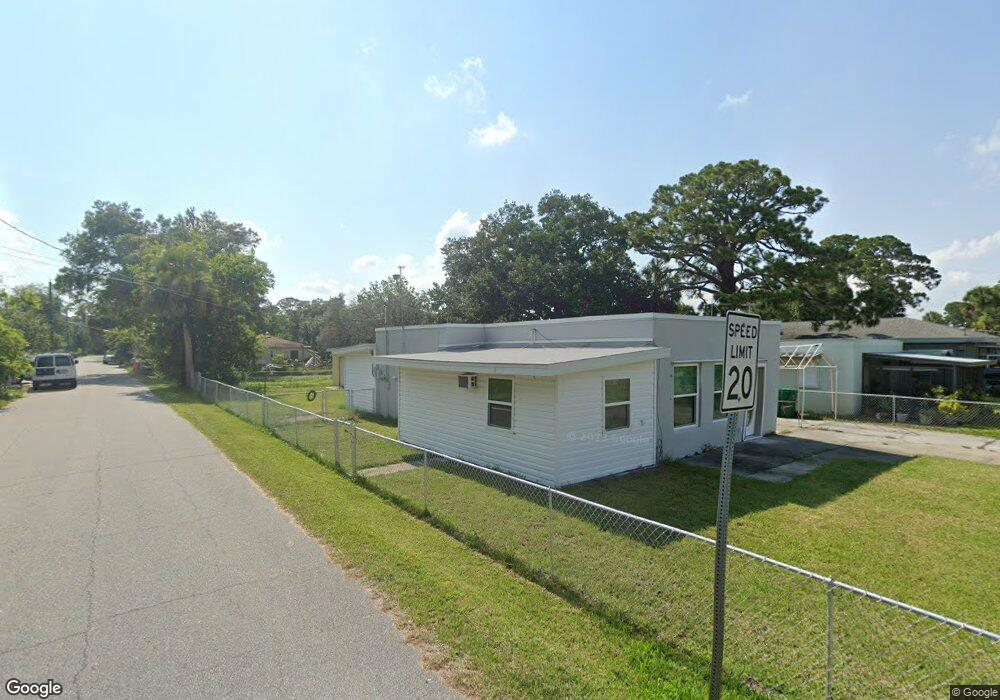
This home is located at 218 Capron Rd, Cocoa, FL 32927 and is currently estimated at $173,702, approximately $191 per square foot. 218 Capron Rd is a home located in Brevard County with nearby schools including Atlantis Elementary School, Space Coast Junior/Senior High School, and East Atlantic Prep of Brevard County.
Ownership History
Date
Name
Owned For
Owner Type
Purchase Details
Closed on
Jun 8, 2020
Sold by
Lippert Kimberly and Lippert Scott
Bought by
Patten Larry and Patten Mary
Current Estimated Value
Purchase Details
Closed on
Feb 1, 2012
Sold by
The Bank Of New York Mellon
Bought by
Stevens Beverlee G
Purchase Details
Closed on
Aug 23, 2007
Sold by
Aegis Mortgage Corp
Bought by
Lippert Scott and Lippert Kimberly
Purchase Details
Closed on
Jun 20, 2007
Sold by
Sowards George E
Bought by
Aegis Mortgage Corp
Purchase Details
Closed on
Mar 3, 2005
Sold by
Johnson Norman T
Bought by
Sowards George E
Home Financials for this Owner
Home Financials are based on the most recent Mortgage that was taken out on this home.
Original Mortgage
$82,300
Interest Rate
7.35%
Purchase Details
Closed on
Nov 8, 2004
Sold by
Hale Timothy W
Bought by
Johnson Norman T
Create a Home Valuation Report for This Property
The Home Valuation Report is an in-depth analysis detailing your home's value as well as a comparison with similar homes in the area
Home Values in the Area
Average Home Value in this Area
Purchase History
| Date | Buyer | Sale Price | Title Company |
|---|---|---|---|
| Patten Larry | -- | None Available | |
| Stevens Beverlee G | $32,300 | Stewart Title Company | |
| Lippert Scott | $56,000 | Fidelity Natl Title Ins Co | |
| Aegis Mortgage Corp | -- | Attorney | |
| Sowards George E | $102,900 | Fidelity Natl Title Ins Co | |
| Johnson Norman T | $48,000 | Fidelity Natl Title Ins Co |
Source: Public Records
Mortgage History
| Date | Status | Borrower | Loan Amount |
|---|---|---|---|
| Previous Owner | Sowards George E | $82,300 | |
| Closed | Sowards George E | $20,500 |
Source: Public Records
Tax History
| Year | Tax Paid | Tax Assessment Tax Assessment Total Assessment is a certain percentage of the fair market value that is determined by local assessors to be the total taxable value of land and additions on the property. | Land | Improvement |
|---|---|---|---|---|
| 2025 | $870 | $71,660 | -- | -- |
| 2024 | $851 | $67,700 | -- | -- |
| 2023 | $851 | $65,730 | $0 | $0 |
| 2022 | $804 | $63,820 | $0 | $0 |
| 2021 | $802 | $61,970 | $14,000 | $47,970 |
| 2020 | $1,247 | $61,940 | $13,000 | $48,940 |
| 2019 | $1,183 | $63,260 | $12,000 | $51,260 |
| 2018 | $1,150 | $61,010 | $12,000 | $49,010 |
| 2017 | $1,044 | $46,520 | $7,500 | $39,020 |
| 2016 | $989 | $39,990 | $6,000 | $33,990 |
| 2015 | $951 | $36,040 | $6,000 | $30,040 |
| 2014 | $897 | $32,770 | $6,000 | $26,770 |
Source: Public Records
Map
Nearby Homes
- 208 Capron Rd
- 0 Kanawha St
- 873 Dunbar St
- 865 Dunbar St
- 214 Chase Rd
- 000 Arabella Ln
- 7400 N Highway 1 Unit 105
- 7470 N Highway 1 Unit 105
- 7420 U S Route 1 Unit 106
- 7350 N Highway 1 Unit 201
- 7330 N Highway 1 Unit 206
- 7310 N Highway 1 Unit 201
- 7300 N Highway 1 Unit 104
- 973 Poinsetta St
- 977 Poinsetta St
- 925 MacCo Rd
- 361 Payne Ave
- 414 Oakridge Ave
- 00 Kings Hwy
- 7070 Bismarck Rd
- 214 Capron Rd
- 899 Kanawha St
- 205 Capron Rd
- 160 Capron Rd
- 0000 Capron Rd
- 228 Capron Rd
- 204 Capron Rd
- 883 Kanawha St
- 874 Kanawha St
- 871 W Virginia St
- 219 Capron Rd
- 887 W Virginia St
- 225 Capron Rd
- 875 Kanawha St
- 209 Capron Rd
- 238 Capron Rd
- 198 Capron Rd
- 693 Brevard Cty St Unit 24
- 693 Brevard Cty St
- 858 Kanawha St
Your Personal Tour Guide
Ask me questions while you tour the home.