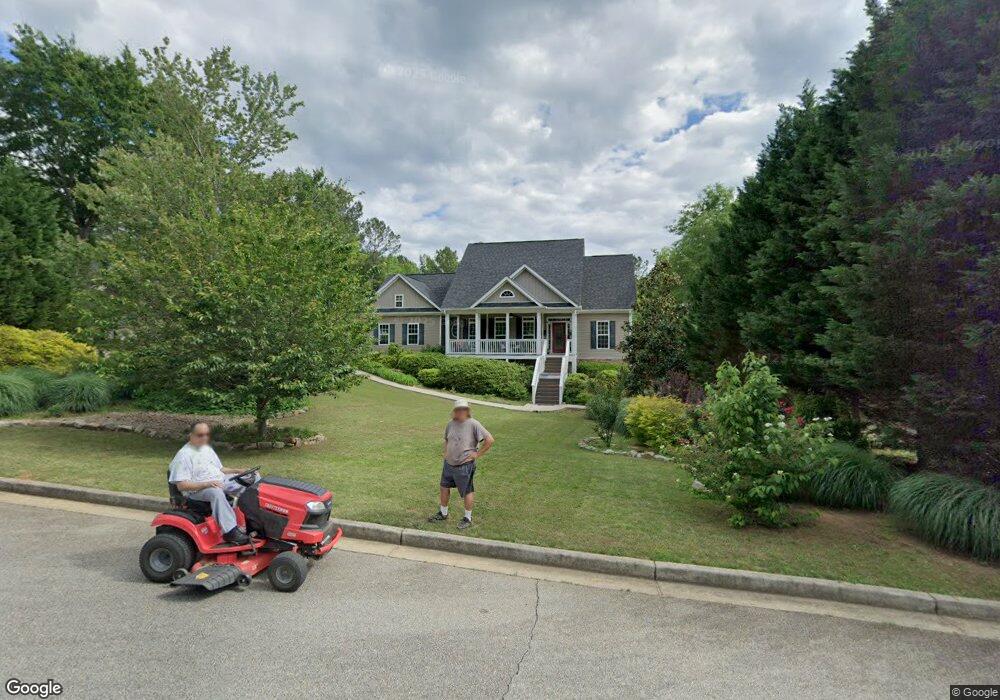
218 Chandlers Run Newnan, GA 30263
Estimated Value: $438,000 - $538,000
4
Beds
3
Baths
2,068
Sq Ft
$230/Sq Ft
Est. Value
About This Home
This home is located at 218 Chandlers Run, Newnan, GA 30263 and is currently estimated at $474,962, approximately $229 per square foot. 218 Chandlers Run is a home located in Coweta County with nearby schools including Arnco-Sargent Elementary School, Evans Middle School, and Newnan High School.
Ownership History
Date
Name
Owned For
Owner Type
Purchase Details
Closed on
Sep 29, 2006
Sold by
Hall Ronald S
Bought by
Galvan Luis A and Galvan Traci L
Current Estimated Value
Home Financials for this Owner
Home Financials are based on the most recent Mortgage that was taken out on this home.
Original Mortgage
$65,000
Outstanding Balance
$38,629
Interest Rate
6.48%
Mortgage Type
New Conventional
Estimated Equity
$436,333
Purchase Details
Closed on
Mar 30, 2006
Sold by
Craig Hemrick Homes Inc
Bought by
Hall Ronald S
Home Financials for this Owner
Home Financials are based on the most recent Mortgage that was taken out on this home.
Original Mortgage
$153,750
Interest Rate
6.25%
Mortgage Type
Purchase Money Mortgage
Purchase Details
Closed on
Feb 27, 2003
Sold by
Ryland Properties Inc
Bought by
Craig Hemrick Homes Inc
Create a Home Valuation Report for This Property
The Home Valuation Report is an in-depth analysis detailing your home's value as well as a comparison with similar homes in the area
Home Values in the Area
Average Home Value in this Area
Purchase History
| Date | Buyer | Sale Price | Title Company |
|---|---|---|---|
| Galvan Luis A | $240,000 | -- | |
| Hall Ronald S | $50,000 | -- | |
| Craig Hemrick Homes Inc | $250,000 | -- |
Source: Public Records
Mortgage History
| Date | Status | Borrower | Loan Amount |
|---|---|---|---|
| Open | Galvan Luis A | $65,000 | |
| Previous Owner | Hall Ronald S | $153,750 |
Source: Public Records
Tax History Compared to Growth
Tax History
| Year | Tax Paid | Tax Assessment Tax Assessment Total Assessment is a certain percentage of the fair market value that is determined by local assessors to be the total taxable value of land and additions on the property. | Land | Improvement |
|---|---|---|---|---|
| 2025 | $4,195 | $182,416 | $24,000 | $158,416 |
| 2024 | $4,161 | $183,820 | $24,000 | $159,820 |
| 2023 | $4,161 | $175,324 | $24,000 | $151,324 |
| 2022 | $3,432 | $144,034 | $16,000 | $128,034 |
| 2021 | $3,376 | $132,910 | $16,000 | $116,910 |
| 2020 | $3,397 | $132,910 | $16,000 | $116,910 |
| 2019 | $2,609 | $93,956 | $8,000 | $85,956 |
| 2018 | $2,615 | $93,956 | $8,000 | $85,956 |
| 2017 | $2,614 | $93,956 | $8,000 | $85,956 |
| 2016 | $2,237 | $81,963 | $8,000 | $73,963 |
| 2015 | $2,126 | $79,297 | $8,000 | $71,297 |
| 2014 | $1,980 | $79,297 | $8,000 | $71,297 |
Source: Public Records
Map
Nearby Homes
- 60 New St
- 0 Macedonia Rd Unit 10587744
- 21 Old Carrollton Rd
- 12 Ulas B Ware Rd
- 1242 Witcher Rd
- 96 Ballyfin Way
- 0 & 1206 Macedonia Rd
- 68 Ballyfin Way
- 13 Tea House Ln Unit 13
- 21 Tea House Ln Unit 21
- 16 Tea House Ln Unit 16
- 1509 Wagers Mill Rd
- 1 Arnco Second St
- 310 Austin Rd
- 279 Doc Perry Rd
- LOT 29 Mossy Oak Ct Unit 29
- 66 Belle Hall Dr Unit 2
- 161 Arnco 6th St
- 142 Arnco 3rd St
- 0 Witcher Rd Unit 14.23+/- AC 10524234
- 232 Chandlers Run
- 206 Chandlers Run
- 280 Chandlers Run
- 244 Chandlers Run
- 200 Chandler's Run Unit LOT 28
- 200 Chandlers Run Unit 28
- 245 Chandler's Run Unit LOT 12
- 217 Chandlers Run
- 256 Chandlers Run
- 0 Chandlers Run NW Unit LOT 48 3289983
- 0 Chandlers Run NW Unit LOT 49 3289982
- 0 Chandlers Run NW Unit LOT 50 3289981
- 0 Chandlers Run NW Unit LOT 52 3289980
- 245 Chandlers Run Unit 12
- 245 Chandlers Run
- 180 Chandlers Run
- 203 Chandlers Run
- 185 Chandlers Run
- 255 Chandlers Run
- 168 Chandler's Run