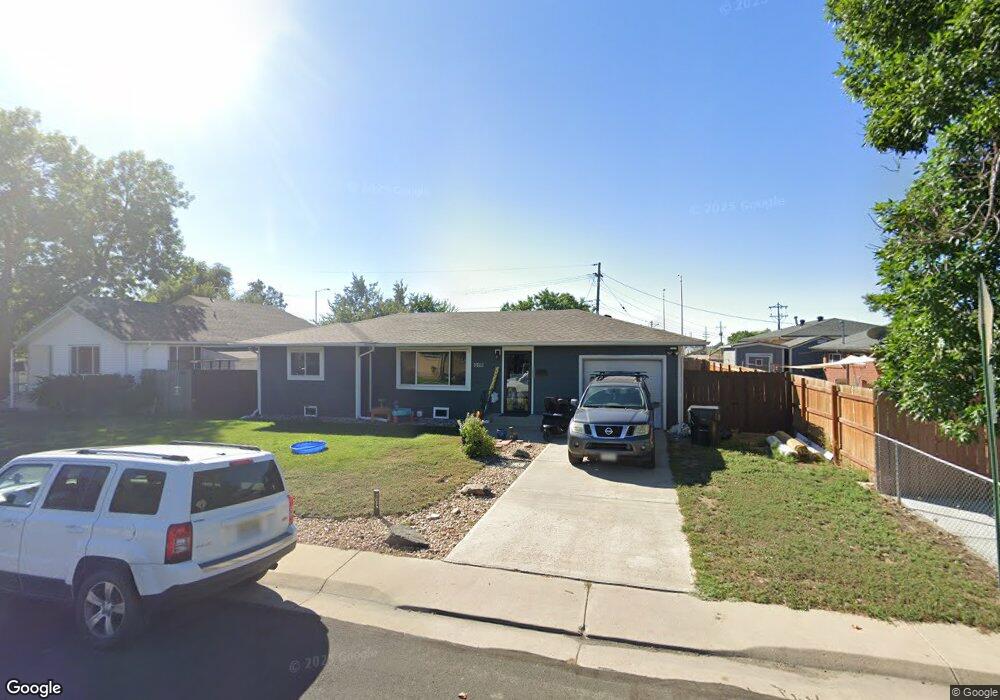
218 Clancy Ct Brighton, CO 80601
Estimated Value: $385,000 - $416,000
3
Beds
1
Bath
1,607
Sq Ft
$249/Sq Ft
Est. Value
About This Home
This home is located at 218 Clancy Ct, Brighton, CO 80601 and is currently estimated at $400,467, approximately $249 per square foot. 218 Clancy Ct is a home located in Adams County with nearby schools including South Elementary School, Vikan Middle School, and Brighton High School.
Ownership History
Date
Name
Owned For
Owner Type
Purchase Details
Closed on
Feb 1, 2017
Sold by
Hedglin Patricia
Bought by
Donovan Devon and Anderson Rachael
Current Estimated Value
Home Financials for this Owner
Home Financials are based on the most recent Mortgage that was taken out on this home.
Original Mortgage
$234,837
Outstanding Balance
$193,113
Interest Rate
4.3%
Mortgage Type
New Conventional
Estimated Equity
$207,354
Purchase Details
Closed on
Aug 14, 2015
Sold by
Lippincott Marie Katherine and Lippincott Marie K
Bought by
Hedglin Patricia
Home Financials for this Owner
Home Financials are based on the most recent Mortgage that was taken out on this home.
Original Mortgage
$196,377
Interest Rate
5.5%
Mortgage Type
FHA
Purchase Details
Closed on
May 20, 2004
Sold by
Knoch Diane Marie and Lippincott Marie Katherine
Bought by
Lippincott Marie Katherine
Purchase Details
Closed on
Jun 8, 1994
Sold by
Mann Marie Katherine and Knoch Diane Marie
Bought by
Lippincott Marie Katherine and Knoch Diane Marie
Create a Home Valuation Report for This Property
The Home Valuation Report is an in-depth analysis detailing your home's value as well as a comparison with similar homes in the area
Home Values in the Area
Average Home Value in this Area
Purchase History
| Date | Buyer | Sale Price | Title Company |
|---|---|---|---|
| Donovan Devon | $242,100 | First American Title | |
| Hedglin Patricia | $200,000 | Land Title Guarantee Company | |
| Lippincott Marie Katherine | -- | -- | |
| Lippincott Marie Katherine | -- | -- |
Source: Public Records
Mortgage History
| Date | Status | Borrower | Loan Amount |
|---|---|---|---|
| Open | Donovan Devon | $234,837 | |
| Previous Owner | Hedglin Patricia | $196,377 |
Source: Public Records
Tax History
| Year | Tax Paid | Tax Assessment Tax Assessment Total Assessment is a certain percentage of the fair market value that is determined by local assessors to be the total taxable value of land and additions on the property. | Land | Improvement |
|---|---|---|---|---|
| 2025 | $2,746 | $26,720 | $6,120 | $20,600 |
| 2024 | $2,746 | $24,570 | $5,630 | $18,940 |
| 2023 | $2,733 | $28,550 | $6,090 | $22,460 |
| 2022 | $2,365 | $21,530 | $5,280 | $16,250 |
| 2021 | $2,217 | $21,530 | $5,280 | $16,250 |
| 2020 | $2,034 | $20,600 | $4,720 | $15,880 |
| 2019 | $2,036 | $20,600 | $4,720 | $15,880 |
| 2018 | $1,493 | $15,100 | $5,400 | $9,700 |
| 2017 | $1,491 | $15,100 | $5,400 | $9,700 |
| 2016 | $1,371 | $13,840 | $2,630 | $11,210 |
| 2015 | $684 | $6,910 | $1,310 | $5,600 |
| 2014 | -- | $6,280 | $1,030 | $5,250 |
Source: Public Records
Map
Nearby Homes
- 141 E Bromley Ln
- 784 S 3rd Ave
- 765 S 1st Ave
- 648 S 3rd Ave
- 617 S 5th Ave
- 865 S 8th Ave
- 475 S 2nd Ave
- 475 S 2nd Ave Unit Plot 1
- 835 S 9th Ave
- 303 S 2nd Ave
- 792 S 12th Ave
- 219 S 3rd Ave
- 362 Dogwood Ave
- 204 E Egbert St
- 285 S 8th Ave
- 230 Ash Ave Unit 4
- 1085 Mockingbird St
- 801 Mockingbird St
- 892 Mockingbird Ln
- 727 Mockingbird St
Your Personal Tour Guide
Ask me questions while you tour the home.