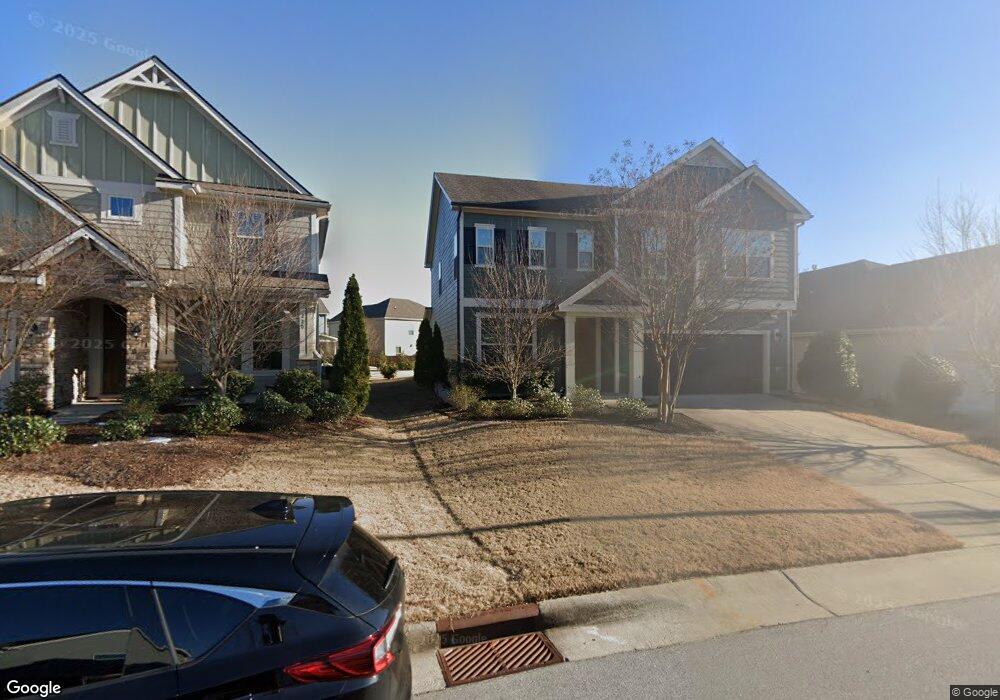
218 Crisp Rd Durham, NC 27713
South Durham NeighborhoodEstimated Value: $624,324 - $699,000
4
Beds
3
Baths
2,440
Sq Ft
$270/Sq Ft
Est. Value
About This Home
This home is located at 218 Crisp Rd, Durham, NC 27713 and is currently estimated at $659,831, approximately $270 per square foot. 218 Crisp Rd is a home located in Durham County with nearby schools including Lowe's Grove Middle, Hillside High School, and AL Huda Academy.
Ownership History
Date
Name
Owned For
Owner Type
Purchase Details
Closed on
Jul 17, 2017
Sold by
Paskey Susan Marie
Bought by
Pasetsky Andrew Jay
Current Estimated Value
Home Financials for this Owner
Home Financials are based on the most recent Mortgage that was taken out on this home.
Original Mortgage
$244,000
Interest Rate
3.93%
Mortgage Type
New Conventional
Purchase Details
Closed on
Aug 26, 2015
Sold by
Meritage Homes Of The Carolinas Inc
Bought by
Pasetsky Andrew and Paskey Susan
Home Financials for this Owner
Home Financials are based on the most recent Mortgage that was taken out on this home.
Original Mortgage
$250,056
Interest Rate
4.16%
Mortgage Type
New Conventional
Purchase Details
Closed on
Nov 3, 2014
Sold by
Community Development Capital Group Llc
Bought by
Meritage Homes Of The Carolinas Inc
Create a Home Valuation Report for This Property
The Home Valuation Report is an in-depth analysis detailing your home's value as well as a comparison with similar homes in the area
Home Values in the Area
Average Home Value in this Area
Purchase History
| Date | Buyer | Sale Price | Title Company |
|---|---|---|---|
| Pasetsky Andrew Jay | -- | None Available | |
| Pasetsky Andrew | $313,000 | Attorney | |
| Meritage Homes Of The Carolinas Inc | $462,000 | None Available |
Source: Public Records
Mortgage History
| Date | Status | Borrower | Loan Amount |
|---|---|---|---|
| Previous Owner | Pasetsky Andrew Jay | $244,000 | |
| Previous Owner | Pasetsky Andrew | $250,056 |
Source: Public Records
Tax History
| Year | Tax Paid | Tax Assessment Tax Assessment Total Assessment is a certain percentage of the fair market value that is determined by local assessors to be the total taxable value of land and additions on the property. | Land | Improvement |
|---|---|---|---|---|
| 2025 | $6,135 | $618,912 | $148,750 | $470,162 |
| 2024 | $4,859 | $348,332 | $89,025 | $259,307 |
| 2023 | $4,563 | $348,332 | $89,025 | $259,307 |
| 2022 | $4,458 | $348,332 | $89,025 | $259,307 |
| 2021 | $4,437 | $348,332 | $89,025 | $259,307 |
| 2020 | $4,333 | $348,332 | $89,025 | $259,307 |
| 2019 | $4,333 | $348,332 | $89,025 | $259,307 |
| 2018 | $4,259 | $313,953 | $65,285 | $248,668 |
| 2017 | $4,227 | $313,953 | $65,285 | $248,668 |
| 2016 | $4,085 | $313,953 | $65,285 | $248,668 |
| 2015 | $983 | $70,977 | $70,977 | $0 |
Source: Public Records
Map
Nearby Homes
- 112 Filigree Way
- 7571 N Carolina 751
- 107 Edward Booth Ln
- 132 Edward Booth Ln
- 512 Whitehall Cir
- 818 Saint Charles St
- 504 Colvard Woods Way
- 282 Colvard Estates Dr
- 908 Noisette Ct
- 1002 Kentlands Dr
- 1017 Whitehall Cir
- 6 Castlewood Dr
- 1416 Newpoint Dr
- 408 Intern Way
- 1008 Whistler St
- 1406 Excelsior Grand Ave
- 102 Higher Learning Dr
- 139 Callowhill Ln
- 819 Watercolor Way
- 204 S Bend Dr
- 216 Crisp Rd
- 220 Crisp Rd
- 220 Crisp Rd
- 1122 Magic Hollow Rd
- 214 Crisp Rd
- 222 Crisp Rd
- 1120 Magic Hollow Rd
- 1118 Magic Hollow Rd
- 224 Crisp Rd
- 219 Crisp Rd
- 1116 Magic Hollow Rd
- 215 Crisp Rd
- 223 Crisp Rd
- 210 Crisp Rd
- 1727 Capstone Dr
- 1725 Capstone Dr
- 213 Crisp Rd
- 1729 Capstone Dr
- 1723 Capstone Dr
- 226 Crisp Rd
Your Personal Tour Guide
Ask me questions while you tour the home.