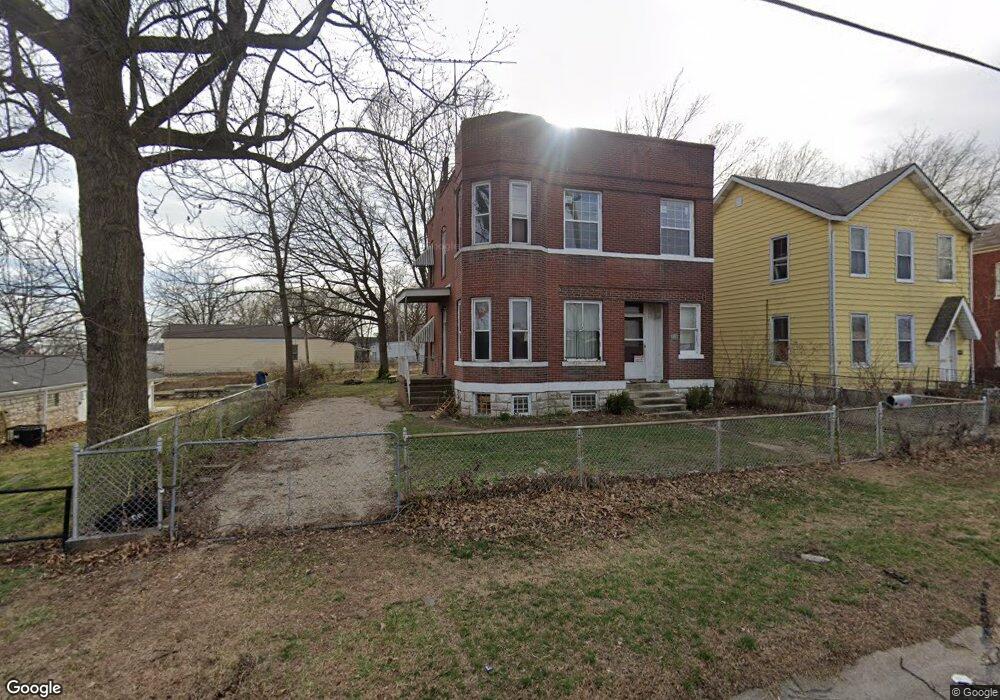
218 E Davis St Saint Louis, MO 63111
Patch NeighborhoodEstimated Value: $43,000 - $172,000
4
Beds
3
Baths
1,908
Sq Ft
$51/Sq Ft
Est. Value
About This Home
This home is located at 218 E Davis St, Saint Louis, MO 63111 and is currently estimated at $97,575, approximately $51 per square foot. 218 E Davis St is a home located in St. Louis City with nearby schools including Lyon at Blow Elementary School, Woerner Elementary School, and Roosevelt High School.
Ownership History
Date
Name
Owned For
Owner Type
Purchase Details
Closed on
Feb 14, 2024
Sold by
Carney William and Carney Carrie
Bought by
Vassalli Bernadette and Vassalli Kenneth
Current Estimated Value
Purchase Details
Closed on
Feb 9, 2012
Sold by
Vericrest Opportunity Loan Trust 2011-Np
Bought by
Carney William
Purchase Details
Closed on
Nov 29, 2011
Sold by
Farewell Anna and Farewell Neil
Bought by
Us Bank Trust National Association and Lsf7 Npl Vi Trust
Purchase Details
Closed on
Mar 12, 2004
Sold by
Vassalli Kenneth and Vassalli Bernadette
Bought by
Farewell Neil and Farewell Anna
Purchase Details
Closed on
Aug 8, 2002
Sold by
Rehfeldt Jeraldine and Rehfeldt Richard J
Bought by
Vassali Kenneth and Vassali Bernadette
Purchase Details
Closed on
May 21, 1997
Sold by
Rehfeldt Jeraldine
Bought by
Rehfeldt Richard L and Rehfeldt Patricia
Create a Home Valuation Report for This Property
The Home Valuation Report is an in-depth analysis detailing your home's value as well as a comparison with similar homes in the area
Home Values in the Area
Average Home Value in this Area
Purchase History
| Date | Buyer | Sale Price | Title Company |
|---|---|---|---|
| Vassalli Bernadette | -- | Investors Title Company | |
| Carney William | -- | Mokan Title Services Llc | |
| Vericrest Opportunity Loan Trust 2011-Np | -- | Mokan Title Services Llc | |
| Us Bank Trust National Association | $55,121 | None Available | |
| Farewell Neil | -- | -- | |
| Vassali Kenneth | -- | -- | |
| Rehfeldt Richard L | -- | -- |
Source: Public Records
Tax History
| Year | Tax Paid | Tax Assessment Tax Assessment Total Assessment is a certain percentage of the fair market value that is determined by local assessors to be the total taxable value of land and additions on the property. | Land | Improvement |
|---|---|---|---|---|
| 2025 | $490 | $4,030 | $1,140 | $2,890 |
| 2024 | $467 | $5,520 | $1,140 | $4,380 |
| 2023 | $467 | $5,520 | $1,140 | $4,380 |
| 2022 | $449 | $5,090 | $1,140 | $3,950 |
| 2021 | $448 | $5,090 | $1,140 | $3,950 |
| 2020 | $429 | $4,900 | $1,140 | $3,760 |
| 2019 | $428 | $4,900 | $1,140 | $3,760 |
| 2018 | $399 | $4,410 | $1,140 | $3,270 |
| 2017 | $393 | $4,410 | $1,140 | $3,270 |
| 2016 | $398 | $4,410 | $1,140 | $3,270 |
| 2015 | $363 | $4,410 | $1,140 | $3,270 |
| 2014 | $353 | $4,410 | $1,140 | $3,270 |
| 2013 | -- | $4,290 | $1,140 | $3,150 |
Source: Public Records
Map
Nearby Homes
- 322 E Davis St
- 8212 Pennsylvania Ave
- 7923 Water St
- 7915 S Broadway
- 7904 Pennsylvania Ave
- 8516 Pennsylvania Ave
- 8522 Pennsylvania Ave
- 7726 Minnesota Ave
- 7711 Minnesota Ave Unit 1
- 545 Davis St
- 7725 Ivory Ave
- 125 Koeln Ave
- 7613 Virginia Ave
- 7326 Pennsylvania Ave
- 7227 Pennsylvania Ave
- 7501 Vermont Ave
- 7343 Virginia Ave
- 213 Waller Ave
- 7205 Pennsylvania Ave
- 206 Waller Ave
Your Personal Tour Guide
Ask me questions while you tour the home.