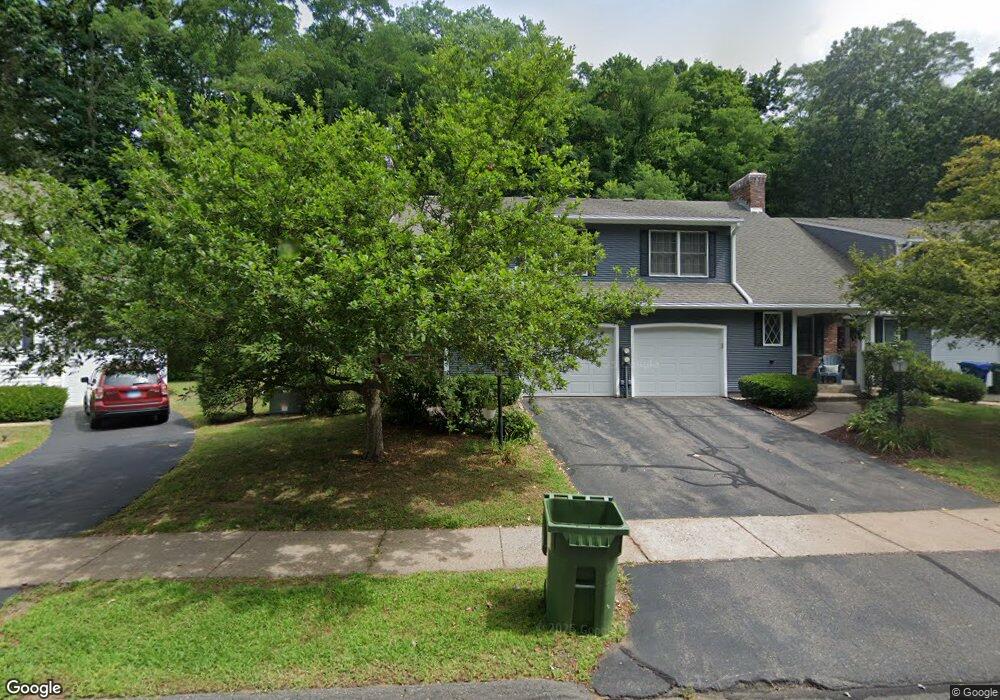
218 Eastwood Cir Windsor, CT 06095
West Windsor NeighborhoodEstimated Value: $283,000 - $308,000
2
Beds
2
Baths
1,224
Sq Ft
$245/Sq Ft
Est. Value
About This Home
This home is located at 218 Eastwood Cir, Windsor, CT 06095 and is currently estimated at $299,937, approximately $245 per square foot. 218 Eastwood Cir is a home located in Hartford County with nearby schools including Poquonock Elementary School, Clover Street School, and Sage Park Middle School.
Ownership History
Date
Name
Owned For
Owner Type
Purchase Details
Closed on
Jul 1, 2016
Sold by
Chamberlain Helena
Bought by
Simpson Laverne
Current Estimated Value
Home Financials for this Owner
Home Financials are based on the most recent Mortgage that was taken out on this home.
Original Mortgage
$128,250
Outstanding Balance
$102,106
Interest Rate
3.58%
Mortgage Type
New Conventional
Estimated Equity
$197,831
Purchase Details
Closed on
Nov 7, 2006
Sold by
Manikas Ann
Bought by
Chamberlain Helena
Purchase Details
Closed on
Sep 24, 2002
Sold by
Harrington William
Bought by
Manikas Ann
Create a Home Valuation Report for This Property
The Home Valuation Report is an in-depth analysis detailing your home's value as well as a comparison with similar homes in the area
Home Values in the Area
Average Home Value in this Area
Purchase History
| Date | Buyer | Sale Price | Title Company |
|---|---|---|---|
| Simpson Laverne | $135,000 | -- | |
| Simpson Laverne | $135,000 | -- | |
| Chamberlain Helena | $195,000 | -- | |
| Chamberlain Helena | $195,000 | -- | |
| Manikas Ann | $144,900 | -- | |
| Manikas Ann | $144,900 | -- | |
| Simpson Laverne | $135,000 | -- | |
| Chamberlain Helena | $195,000 | -- | |
| Manikas Ann | $144,900 | -- | |
| Simpson Laverne | $135,000 | -- | |
| Chamberlain Helena | $195,000 | -- | |
| Manikas Ann | $144,900 | -- |
Source: Public Records
Mortgage History
| Date | Status | Borrower | Loan Amount |
|---|---|---|---|
| Open | Manikas Ann | $128,250 | |
| Closed | Manikas Ann | $128,250 |
Source: Public Records
Tax History Compared to Growth
Tax History
| Year | Tax Paid | Tax Assessment Tax Assessment Total Assessment is a certain percentage of the fair market value that is determined by local assessors to be the total taxable value of land and additions on the property. | Land | Improvement |
|---|---|---|---|---|
| 2025 | $4,700 | $165,200 | $42,000 | $123,200 |
| 2024 | $5,009 | $165,200 | $42,000 | $123,200 |
| 2023 | $3,293 | $98,000 | $23,940 | $74,060 |
| 2022 | $3,260 | $98,000 | $23,940 | $74,060 |
| 2021 | $3,260 | $98,000 | $23,940 | $74,060 |
| 2020 | $3,245 | $98,000 | $23,940 | $74,060 |
| 2019 | $3,173 | $98,000 | $23,940 | $74,060 |
| 2018 | $3,851 | $116,830 | $23,940 | $92,890 |
| 2017 | $3,791 | $116,830 | $23,940 | $92,890 |
| 2016 | $3,682 | $116,830 | $23,940 | $92,890 |
| 2015 | $3,612 | $116,830 | $23,940 | $92,890 |
| 2014 | $3,560 | $116,830 | $23,940 | $92,890 |
Source: Public Records
Map
Nearby Homes
- 63 Stage Coach Rd
- 225 Rollingbrook
- 129 Hollow Brook Rd
- 35 George Rd
- 98 High Path Rd
- 114 High Path Rd Unit 114
- 33 Old Village Cir
- 65 Greenfield Dr
- 142 High Path Rd
- 31 Laurel Rd
- 17 Fox Hollow Dr Unit 17
- 12 Woodridge Dr Unit 12
- 268 High Path Rd Unit 268
- 45 Timothy Terrace
- 2 Concorde Way Unit A4
- 23 Griswold Dr
- 9 Alford Dr
- 190 Prospect Hill Rd
- 57 Pershing Rd
- 22 Eastview Dr
- 218 Eastwood Cir Unit 218
- 214 Eastwood Cir
- 214 Eastwood Cir
- 214 Eastwood Cir Unit 214
- 210 Eastwood Cir
- 210 Eastwood Cir
- 222 Eastwood Cir
- 206 Eastwood Cir
- 226 Eastwood Cir
- 202 Eastwood Cir
- 230 Eastwood Cir
- 230 Eastwood Cir Unit 230
- 198 Eastwood Cir
- 198 Eastwood Cir Unit 198
- 234 Eastwood Cir
- 194 Eastwood Cir
- 190 Eastwood Cir
- 186 Eastwood Cir
- 186 Eastwood Cir Unit 186