218 Heischman Ave Worthington, OH 43085
Estimated Value: $524,000 - $566,000
4
Beds
3
Baths
1,986
Sq Ft
$274/Sq Ft
Est. Value
About This Home
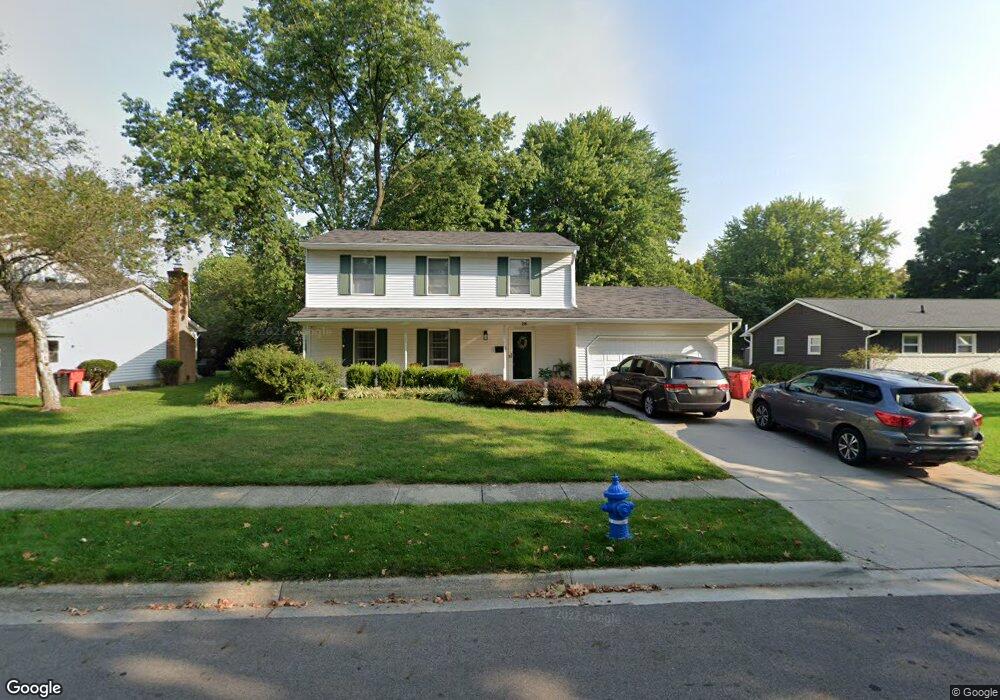
This home is located at 218 Heischman Ave, Worthington, OH 43085 and is currently estimated at $543,471, approximately $273 per square foot. 218 Heischman Ave is a home located in Franklin County with nearby schools including Wilson Hill Elementary School, Kilbourne Middle School, and Thomas Worthington High School.
Ownership History
Date
Name
Owned For
Owner Type
Purchase Details
Closed on
Jul 23, 2021
Sold by
Meadows Keith R and Meadows Emily A
Bought by
Bradley Robert Michael
Current Estimated Value
Home Financials for this Owner
Home Financials are based on the most recent Mortgage that was taken out on this home.
Original Mortgage
$415,150
Interest Rate
2.7%
Mortgage Type
New Conventional
Purchase Details
Closed on
May 18, 2009
Sold by
Cahilll Tim and Cahill Pia
Bought by
Meadows Keith R and Hofstetter Emily A
Home Financials for this Owner
Home Financials are based on the most recent Mortgage that was taken out on this home.
Original Mortgage
$262,616
Interest Rate
4.9%
Mortgage Type
FHA
Purchase Details
Closed on
Jul 1, 2005
Sold by
Thrall Geoffrey M and The Geoffrey M Thrall Revocabl
Bought by
Cahill Tim and Cahill Pia
Create a Home Valuation Report for This Property
The Home Valuation Report is an in-depth analysis detailing your home's value as well as a comparison with similar homes in the area
Home Values in the Area
Average Home Value in this Area
Purchase History
| Date | Buyer | Sale Price | Title Company |
|---|---|---|---|
| Bradley Robert Michael | $450,000 | Accommodation | |
| Meadows Keith R | $267,500 | Attorney | |
| Cahill Tim | $249,500 | Chicago Tit |
Source: Public Records
Mortgage History
| Date | Status | Borrower | Loan Amount |
|---|---|---|---|
| Previous Owner | Bradley Robert Michael | $415,150 | |
| Previous Owner | Meadows Keith R | $262,616 |
Source: Public Records
Tax History Compared to Growth
Tax History
| Year | Tax Paid | Tax Assessment Tax Assessment Total Assessment is a certain percentage of the fair market value that is determined by local assessors to be the total taxable value of land and additions on the property. | Land | Improvement |
|---|---|---|---|---|
| 2024 | $8,481 | $133,640 | $46,660 | $86,980 |
| 2023 | $8,122 | $133,630 | $46,655 | $86,975 |
| 2022 | $7,270 | $95,590 | $36,960 | $58,630 |
| 2021 | $6,722 | $95,590 | $36,960 | $58,630 |
| 2020 | $6,482 | $95,590 | $36,960 | $58,630 |
| 2019 | $6,042 | $80,640 | $36,960 | $43,680 |
| 2018 | $5,923 | $80,640 | $36,960 | $43,680 |
| 2017 | $5,432 | $80,640 | $36,960 | $43,680 |
| 2016 | $5,987 | $81,940 | $29,050 | $52,890 |
| 2015 | $5,988 | $81,940 | $29,050 | $52,890 |
| 2014 | $5,986 | $81,940 | $29,050 | $52,890 |
| 2013 | $2,836 | $78,015 | $27,650 | $50,365 |
Source: Public Records
Map
Nearby Homes
- 127 Heischman Ave
- 6730 Kensington Way
- 6750 Worthington Galena Rd
- 251 Northigh Dr
- 120 Caren Ave
- 6813 Hayhurst St
- 463 E North St Unit D-5
- 0 Proprietors Rd Unit 225002452
- 188 E Clearview Ave
- 930 Proprietors Rd
- 675 Plymouth St
- 477 Olenwood Ave
- 554 Haymore Ave N
- 264 E South St
- 519 Pincherry Ln
- 0 Pocono Rd Unit 225030021
- 551 Oxford St
- 795 Plant Dr Unit 8C
- 143 W South St
- 694 Keys View Ct Unit 78
- 226 Heischman Ave
- 208 Heischman Ave
- 219 Halligan Ave
- 211 Halligan Ave
- 236 Heischman Ave
- 198 Heischman Ave
- 229 Halligan Ave
- 217 Heischman Ave
- 203 Halligan Ave
- 225 Heischman Ave
- 209 Heischman Ave
- 237 Halligan Ave
- 6784 Joslyn Place
- 244 Heischman Ave
- 235 Heischman Ave
- 199 Heischman Ave
- 191 Halligan Ave
- 245 Halligan Ave
- 243 Heischman Ave
- 189 Heischman Ave