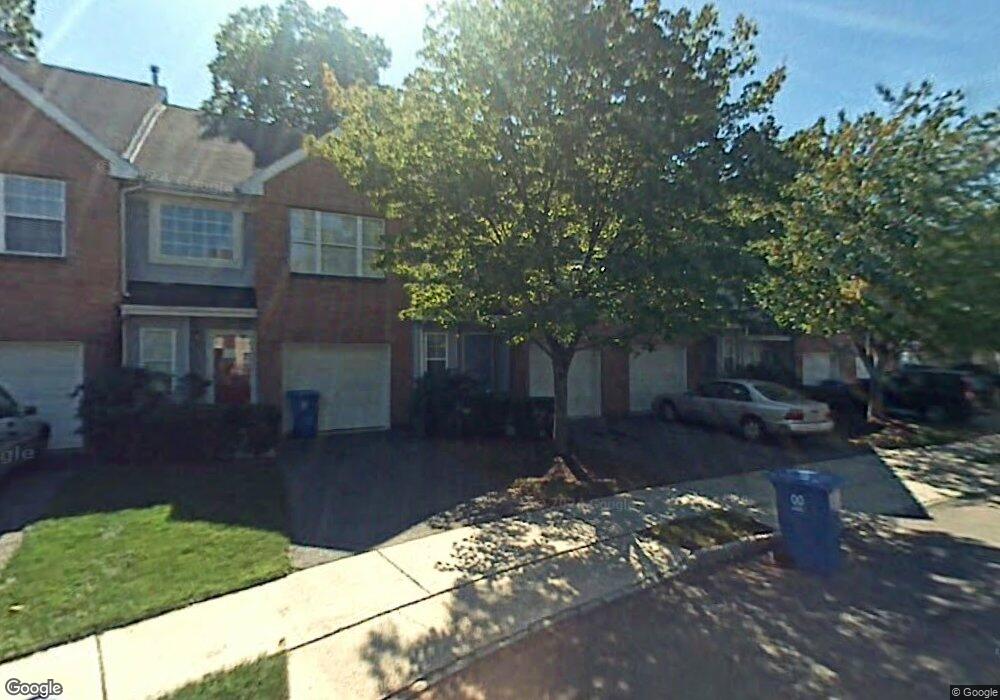
218 Hidden Woods Ct Unit B Piscataway, NJ 08854
Estimated Value: $459,000 - $502,000
3
Beds
3
Baths
1,440
Sq Ft
$338/Sq Ft
Est. Value
About This Home
This home is located at 218 Hidden Woods Ct Unit B, Piscataway, NJ 08854 and is currently estimated at $486,896, approximately $338 per square foot. 218 Hidden Woods Ct Unit B is a home located in Middlesex County with nearby schools including Dwight D. Eisenhower School, Arbor Intermediate School, and Quibbletown Middle School.
Ownership History
Date
Name
Owned For
Owner Type
Purchase Details
Closed on
Sep 28, 2005
Sold by
Staten Danielle
Bought by
Huang Xinyu and Liu Xiangqun
Current Estimated Value
Home Financials for this Owner
Home Financials are based on the most recent Mortgage that was taken out on this home.
Original Mortgage
$244,800
Outstanding Balance
$131,276
Interest Rate
5.79%
Estimated Equity
$355,620
Purchase Details
Closed on
Oct 28, 1997
Sold by
Pacini Richard
Bought by
Staten Danielle
Home Financials for this Owner
Home Financials are based on the most recent Mortgage that was taken out on this home.
Original Mortgage
$121,000
Interest Rate
7.23%
Mortgage Type
FHA
Purchase Details
Closed on
Aug 19, 1993
Sold by
Hidden Woods Inc
Bought by
Pacini Richard
Home Financials for this Owner
Home Financials are based on the most recent Mortgage that was taken out on this home.
Original Mortgage
$115,000
Interest Rate
7.11%
Create a Home Valuation Report for This Property
The Home Valuation Report is an in-depth analysis detailing your home's value as well as a comparison with similar homes in the area
Home Values in the Area
Average Home Value in this Area
Purchase History
| Date | Buyer | Sale Price | Title Company |
|---|---|---|---|
| Huang Xinyu | $306,000 | -- | |
| Staten Danielle | $125,000 | -- | |
| Pacini Richard | $127,900 | -- |
Source: Public Records
Mortgage History
| Date | Status | Borrower | Loan Amount |
|---|---|---|---|
| Open | Huang Xinyu | $244,800 | |
| Previous Owner | Staten Danielle | $121,000 | |
| Previous Owner | Pacini Richard | $115,000 |
Source: Public Records
Tax History Compared to Growth
Tax History
| Year | Tax Paid | Tax Assessment Tax Assessment Total Assessment is a certain percentage of the fair market value that is determined by local assessors to be the total taxable value of land and additions on the property. | Land | Improvement |
|---|---|---|---|---|
| 2025 | $7,905 | $442,100 | $229,100 | $213,000 |
| 2024 | $7,148 | $409,600 | $200,500 | $209,100 |
| 2023 | $7,148 | $346,000 | $141,800 | $204,200 |
| 2022 | $7,486 | $336,300 | $141,800 | $194,500 |
| 2021 | $6,423 | $277,200 | $103,100 | $174,100 |
| 2020 | $6,173 | $267,000 | $97,400 | $169,600 |
| 2019 | $6,468 | $274,900 | $97,400 | $177,500 |
| 2018 | $6,195 | $264,500 | $97,400 | $167,100 |
| 2017 | $6,482 | $239,100 | $90,000 | $149,100 |
| 2016 | $6,365 | $239,100 | $90,000 | $149,100 |
| 2015 | $6,269 | $239,100 | $90,000 | $149,100 |
| 2014 | $6,131 | $239,100 | $90,000 | $149,100 |
Source: Public Records
Map
Nearby Homes
- 72 Carlton Ave
- 267 Shady Oak Ct
- 1514 S Washington Ave
- 900 S Washington Ave
- 1122 Hanover St
- 155 Summers Ave
- 1206 Charter St
- 47 Brandywine Cir
- 651 Fairview Ave
- 113 Summers Ave
- 850 Mohill Place
- 1204 S Washington Ave
- 625 Fairview Ave
- 615 Dial Ave
- 634 S Washington Ave
- 614 S Washington Ave
- 114 Hamilton Blvd
- 35 Murray Ave
- 114 Woodrow Ave
- 24 Old New Brunswick Rd
- 218 Hidden Woods Ct
- 217 Hidden Woods Ct
- 220 Hidden Woods Ct
- 216 Hidden Woods Ct
- 215 Hidden Woods Ct
- 214 Hidden Woods Ct
- 76 Carlton Ave
- 221 Hidden Woods Ct
- 213 Hidden Woods Ct
- 222 Hidden Woods Ct
- 259 Shady Oak Ct
- 80 Carlton Ave
- 260 Shady Oak Ct
- 74 Carlton Ave
- 261 Shady Oak Ct
- 262 Shady Oak Ct
- 212 Hidden Woods Ct
- 224 Hidden Woods Ct
- 263 Shady Oak Ct
- 211 Hidden Woods Ct