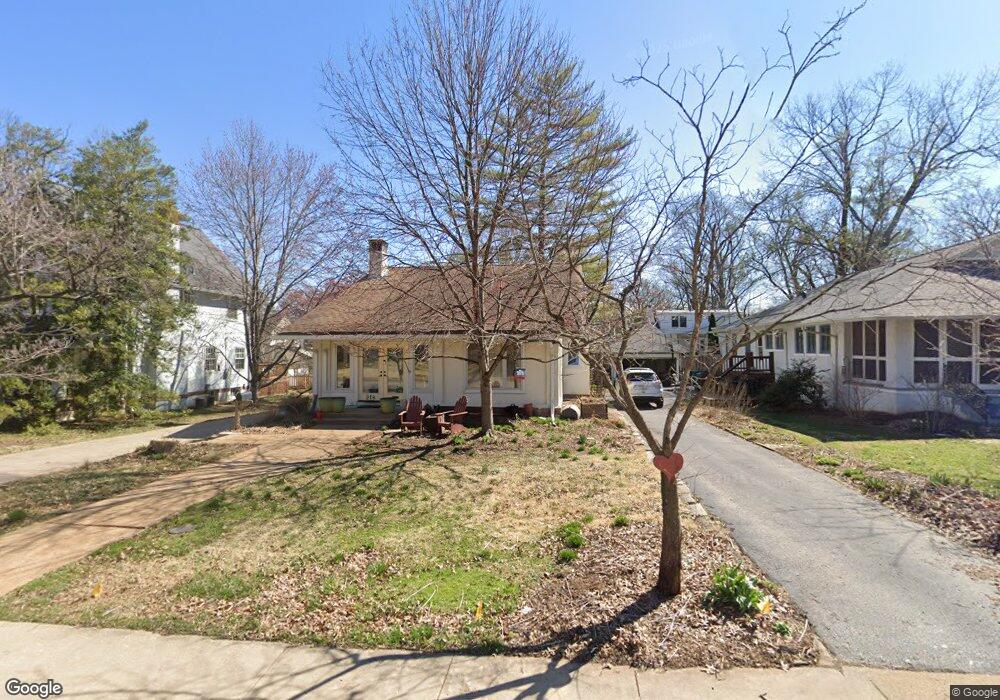
218 Jefferson Rd Saint Louis, MO 63119
Estimated Value: $451,000 - $786,000
3
Beds
2
Baths
2,020
Sq Ft
$284/Sq Ft
Est. Value
About This Home
This home is located at 218 Jefferson Rd, Saint Louis, MO 63119 and is currently estimated at $573,844, approximately $284 per square foot. 218 Jefferson Rd is a home located in St. Louis County with nearby schools including Bristol Elementary School, Hixson Middle School, and Webster Groves High School.
Ownership History
Date
Name
Owned For
Owner Type
Purchase Details
Closed on
Jan 14, 2022
Sold by
Breeze Carol A
Bought by
Breeze Carol A
Current Estimated Value
Home Financials for this Owner
Home Financials are based on the most recent Mortgage that was taken out on this home.
Original Mortgage
$246,000
Outstanding Balance
$210,712
Interest Rate
3.11%
Mortgage Type
New Conventional
Estimated Equity
$363,132
Purchase Details
Closed on
Mar 26, 2021
Sold by
Breeze Carol A
Bought by
Breeze Carol A and Carol A Breeze Trust
Purchase Details
Closed on
Sep 29, 2010
Sold by
Stevens Elizabeth
Bought by
Breeze Carol A
Home Financials for this Owner
Home Financials are based on the most recent Mortgage that was taken out on this home.
Original Mortgage
$280,000
Interest Rate
4.42%
Mortgage Type
New Conventional
Purchase Details
Closed on
Dec 27, 2007
Sold by
Stevens Gregory Todd and Stevens Elizabeth Anne
Bought by
Stevens Elizabeth
Create a Home Valuation Report for This Property
The Home Valuation Report is an in-depth analysis detailing your home's value as well as a comparison with similar homes in the area
Home Values in the Area
Average Home Value in this Area
Purchase History
| Date | Buyer | Sale Price | Title Company |
|---|---|---|---|
| Breeze Carol A | -- | Netco Title | |
| Breeze Carol A | -- | None Listed On Document | |
| Breeze Carol A | $350,000 | None Available | |
| Stevens Elizabeth | $350,620 | Copper Land & Title | |
| Stevens Gregory Todd | -- | Copper Land & Title |
Source: Public Records
Mortgage History
| Date | Status | Borrower | Loan Amount |
|---|---|---|---|
| Open | Breeze Carol A | $246,000 | |
| Previous Owner | Breeze Carol A | $280,000 |
Source: Public Records
Tax History Compared to Growth
Tax History
| Year | Tax Paid | Tax Assessment Tax Assessment Total Assessment is a certain percentage of the fair market value that is determined by local assessors to be the total taxable value of land and additions on the property. | Land | Improvement |
|---|---|---|---|---|
| 2025 | $4,904 | $90,560 | $60,140 | $30,420 |
| 2024 | $4,904 | $70,410 | $41,360 | $29,050 |
| 2023 | $4,904 | $70,410 | $41,360 | $29,050 |
| 2022 | $4,704 | $63,020 | $41,360 | $21,660 |
| 2021 | $4,688 | $63,020 | $41,360 | $21,660 |
| 2020 | $5,047 | $63,250 | $48,640 | $14,610 |
| 2019 | $5,011 | $63,250 | $48,640 | $14,610 |
| 2018 | $5,115 | $57,360 | $37,580 | $19,780 |
| 2017 | $5,080 | $57,360 | $37,580 | $19,780 |
| 2016 | $4,396 | $47,450 | $30,100 | $17,350 |
| 2015 | $4,415 | $47,450 | $30,100 | $17,350 |
| 2014 | $5,102 | $53,410 | $13,450 | $39,960 |
Source: Public Records
Map
Nearby Homes
- 200 Blackmer Place
- 340 Gray Ave
- 156 Gray Ave
- 368 S Gore Ave
- 514 S Gore Ave
- 426 S Maple Ave
- 426 W Kirkham Ave
- 404 W Kirkham Ave
- 234 Plant Ave
- 125 E Frisco Ave
- 203 E Jackson Rd
- 541 W Kirkham Ave
- 136 N Gore Ave
- 8361 Big Bend Blvd
- 426 Pasadena Ave
- 112 Oakwood Ave
- 1139 Hawken Place Unit 6
- 802 S Berry Rd
- 450 E Lockwood Ave Unit 303
- 218 Euclid Ave
- 214 Jefferson Rd
- 222 Jefferson Rd
- 215 Parkhurst Terrace
- 210 Jefferson Rd
- 211 Parkhurst Terrace
- 221 Parkhurst Terrace
- 228 Jefferson Rd
- 207 Parkhurst Terrace
- 217 Jefferson Rd
- 225 Jefferson Rd
- 200 Jefferson Rd
- 215 Jefferson Rd
- 250 Jefferson Rd
- 235 Jefferson Rd
- 203 Parkhurst Terrace
- 205 Jefferson Rd
- 255 Jefferson Rd
- 300 Jefferson Rd
- 218 Parkhurst Terrace
- 214 Parkhurst Terrace