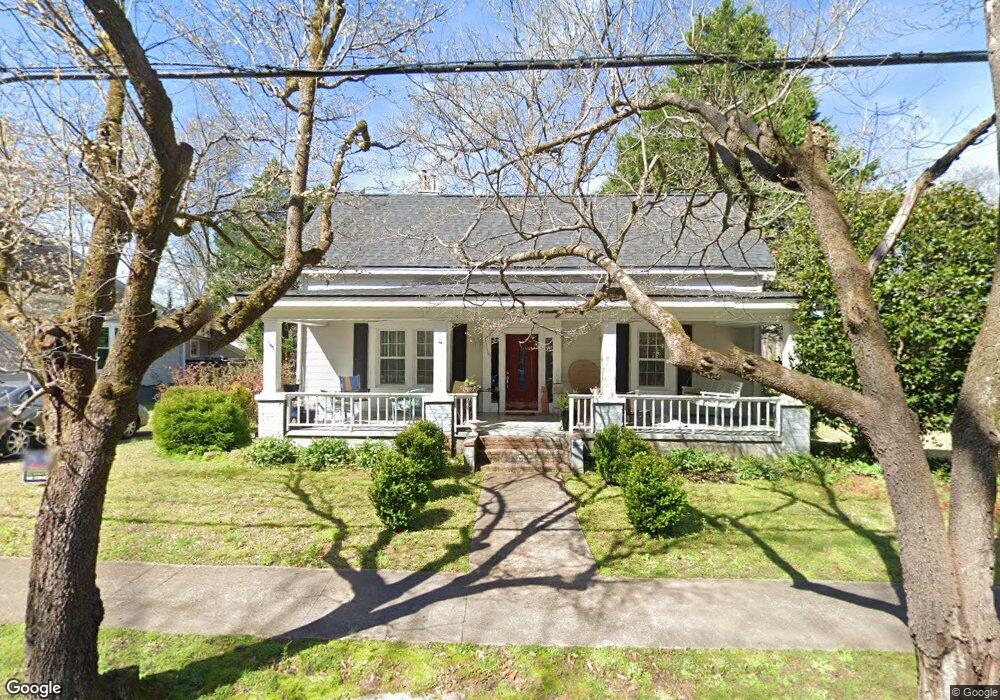
218 Johnson St Hogansville, GA 30230
Estimated Value: $187,612 - $234,000
2
Beds
1
Bath
1,415
Sq Ft
$151/Sq Ft
Est. Value
About This Home
This home is located at 218 Johnson St, Hogansville, GA 30230 and is currently estimated at $213,153, approximately $150 per square foot. 218 Johnson St is a home located in Troup County with nearby schools including Hogansville Elementary School, Callaway Elementary School, and Callaway Middle School.
Ownership History
Date
Name
Owned For
Owner Type
Purchase Details
Closed on
Dec 1, 2009
Sold by
Vandiver Ulysses D
Bought by
Hazelgrove Maralyn
Current Estimated Value
Purchase Details
Closed on
Sep 30, 2005
Sold by
Vandiver Susan Elaine
Bought by
Vandiver Ulysses D and Vandiver Elaine
Purchase Details
Closed on
Aug 28, 2000
Sold by
Survivorship Deed and Susan Elaine
Bought by
Susan Susan E and Susan Vandiver U
Purchase Details
Closed on
Mar 31, 1994
Sold by
Vandiver U D
Bought by
Survivorship Deed and Susan Elaine
Purchase Details
Closed on
Jul 30, 1993
Sold by
Jack E Jeter
Bought by
Vandiver U D
Purchase Details
Closed on
Feb 1, 1993
Sold by
Metta Mae Turner Jeter
Bought by
Jack E Jeter
Purchase Details
Closed on
Jun 14, 1979
Sold by
Jeter W B
Bought by
Metta Mae Turner Jeter
Purchase Details
Closed on
Jun 20, 1969
Bought by
Jeter W B
Create a Home Valuation Report for This Property
The Home Valuation Report is an in-depth analysis detailing your home's value as well as a comparison with similar homes in the area
Home Values in the Area
Average Home Value in this Area
Purchase History
| Date | Buyer | Sale Price | Title Company |
|---|---|---|---|
| Hazelgrove Maralyn | $113,400 | -- | |
| Hazelgrove Maralyn | $113,400 | -- | |
| Vandiver Ulysses D | -- | -- | |
| Susan Susan E | -- | -- | |
| Survivorship Deed | -- | -- | |
| Vandiver U D | $27,000 | -- | |
| Jack E Jeter | -- | -- | |
| Metta Mae Turner Jeter | -- | -- | |
| Jeter W B | -- | -- |
Source: Public Records
Tax History Compared to Growth
Tax History
| Year | Tax Paid | Tax Assessment Tax Assessment Total Assessment is a certain percentage of the fair market value that is determined by local assessors to be the total taxable value of land and additions on the property. | Land | Improvement |
|---|---|---|---|---|
| 2024 | $1,607 | $47,176 | $5,960 | $41,216 |
| 2023 | $1,504 | $44,236 | $5,960 | $38,276 |
| 2022 | $1,412 | $40,916 | $5,960 | $34,956 |
| 2021 | $1,471 | $40,180 | $5,960 | $34,220 |
| 2020 | $1,531 | $40,180 | $5,960 | $34,220 |
| 2019 | $1,149 | $30,160 | $3,120 | $27,040 |
| 2018 | $1,058 | $27,756 | $3,120 | $24,636 |
| 2017 | $1,058 | $27,756 | $3,120 | $24,636 |
| 2016 | $1,033 | $27,109 | $3,120 | $23,989 |
| 2015 | $1,067 | $27,970 | $3,981 | $23,989 |
| 2014 | $1,021 | $26,708 | $3,981 | $22,726 |
| 2013 | -- | $27,908 | $3,981 | $23,927 |
Source: Public Records
Map
Nearby Homes
- 215 Johnson St
- 213 Johnson St
- 208 Church St
- 0 Georgia 100 Unit 10591508
- 608 Rifle Ridge
- 613 Rifle Ridge
- 617 Rifle Ridge
- 619 Rifle Ridge
- 614 Rifle Ridge
- 201 Oak St
- 100 International St
- 113 Ware St
- 201 Elm St
- 400 Lawrence St
- 340 Foxtrot Trail
- 341 Foxtrot Trail
- 342 Foxtrot Trail
- 344 Foxtrot Trail
- 346 Foxtrot Trail
- 214 Collier St
- 220 Johnson St
- 216 Johnson St
- 219 Johnson St
- 0 Johnson St Unit 7536088
- 0 Johnson St Unit 7133224
- 0 Johnson St Unit 8488610
- 0 Johnson St Unit 7550693
- 0 Johnson St Unit 7221220
- 0 Johnson St Unit 8172169
- 0 Johnson St Unit 8119223
- 0 Johnson St Unit 8086265
- 0 Johnson St Unit 7404214
- 0 Johnson St Unit 7106356
- 0 Johnson St Unit 8849989
- 0 Johnson St Unit 8114665
- 0 Johnson St Unit 9018822
- 0 Johnson St Unit 9031960
- 0 Johnson St Unit 8768731
- 0 Johnson St Unit 3128653
- 0 Johnson St